This topic contains a solution. Click here to go to the answer
|
|
|

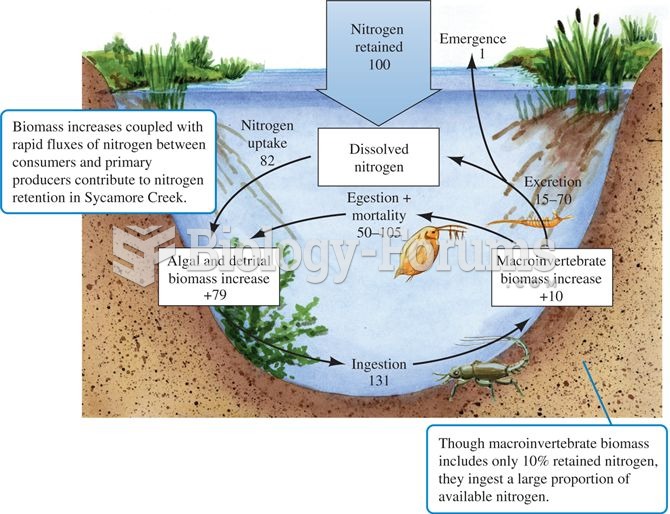 Nitrogen fluxes in Sycamore Creek, Arizona (data from Grimm 1988).
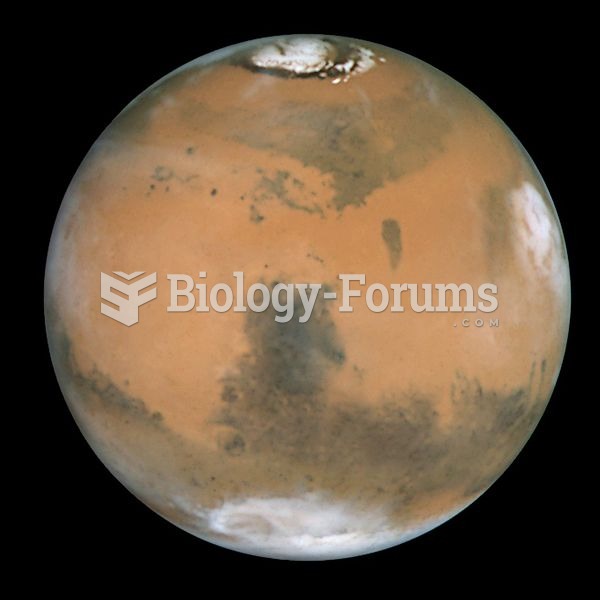 True-color view of Mars seen through NASA's Hubble Space Telescope in 1999
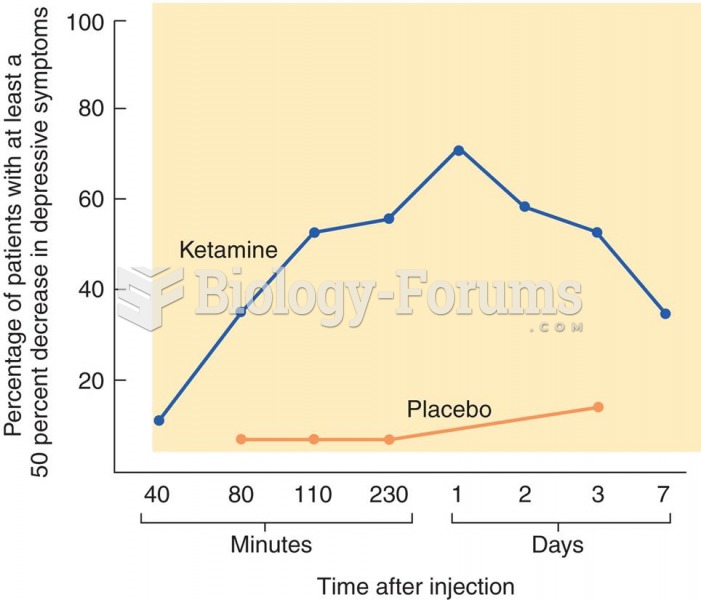 Treatment of Depression with Ketamine The graph shows the effects of ketamine on symptoms of depress
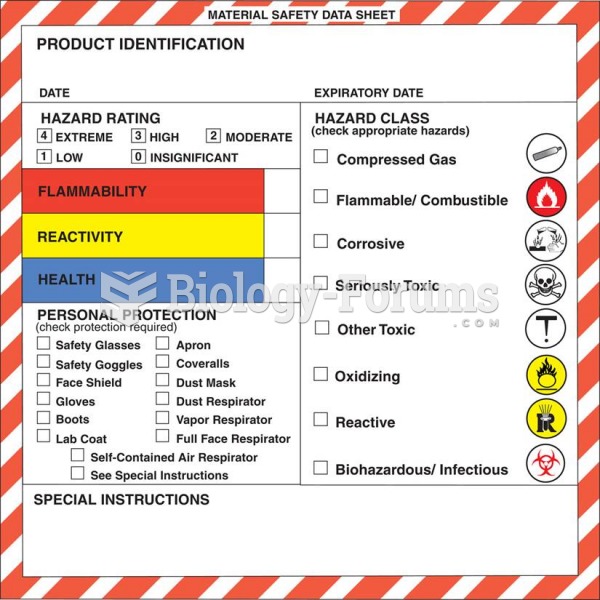 An example of a Material Safety Data Sheet (MSDS).
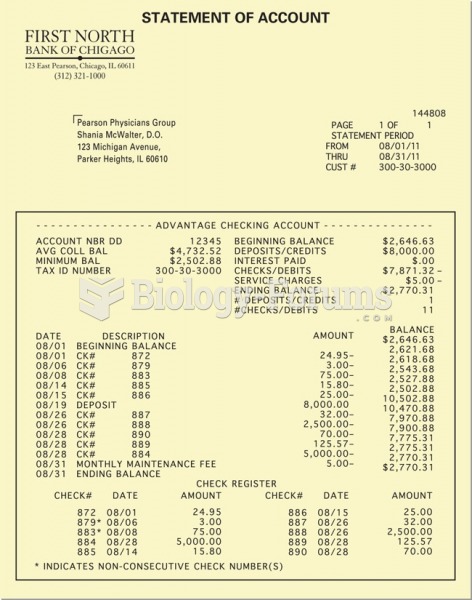 A typical bank statement.
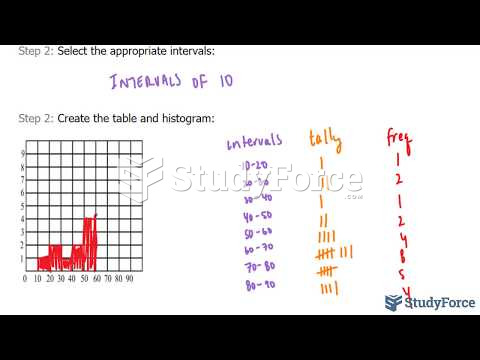 How to create a frequency table and histogram from raw data