|
|
|

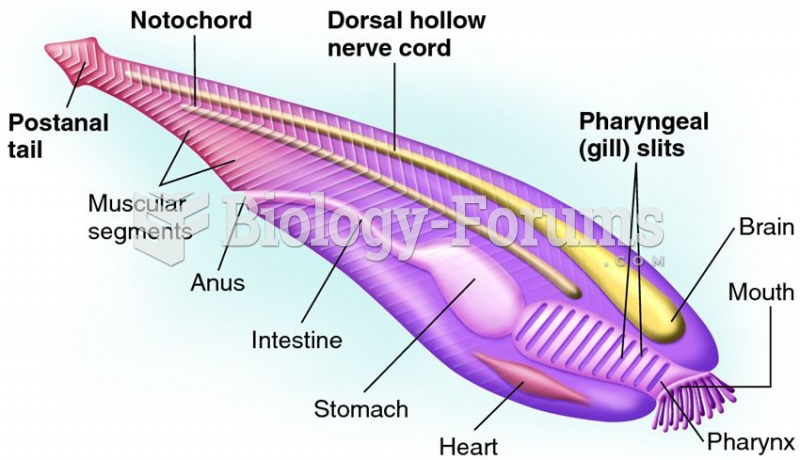 Chordate characteristics
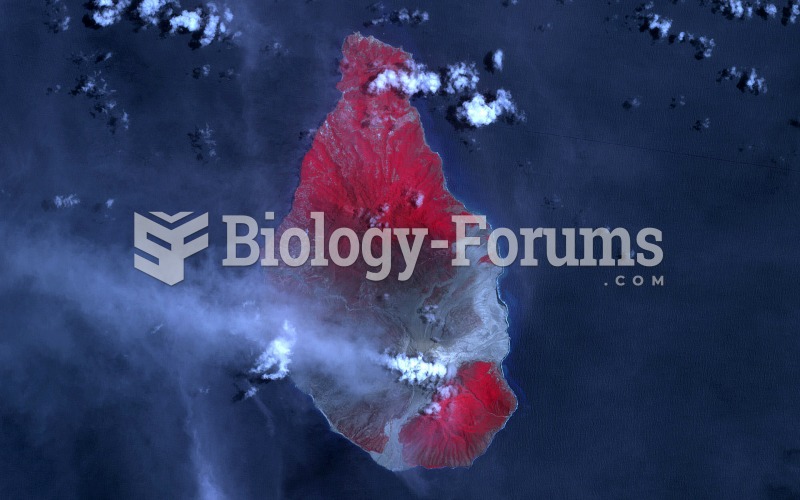 Amazing NASA Pictures Collection
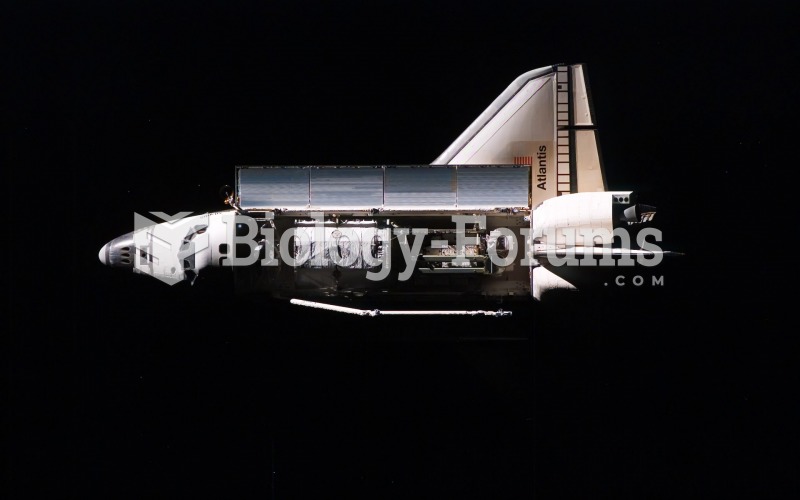 Amazing NASA Pictures Collection
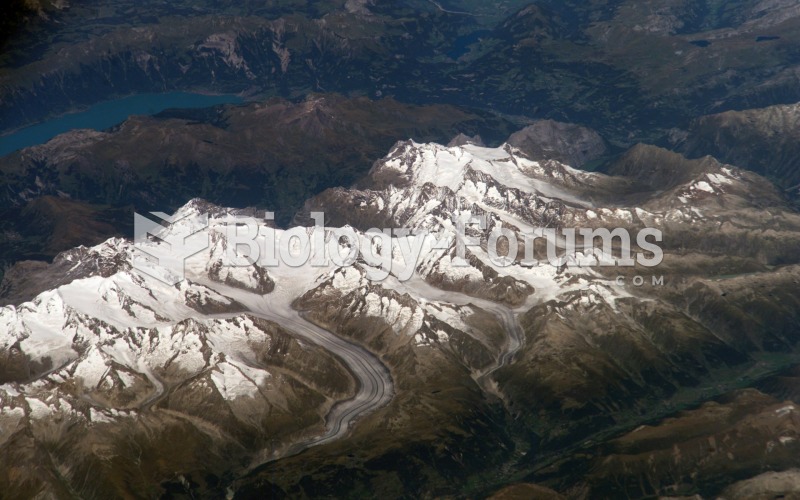 Amazing NASA Pictures Collection
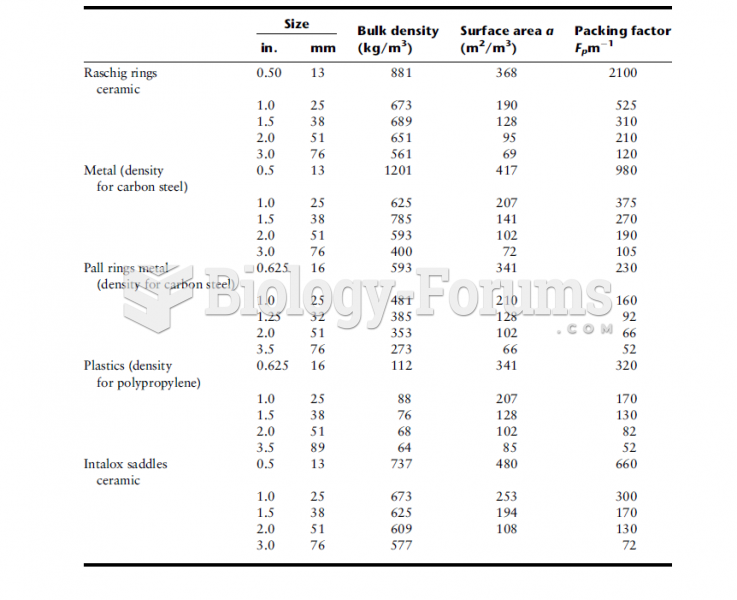 Design Data for Various Packings
 Gamete genotype frequencies calculated from genetic linkage data