This topic contains a solution. Click here to go to the answer
|
|
|

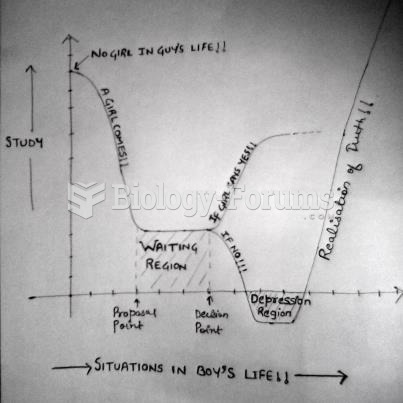 Situation in a Guy's Life
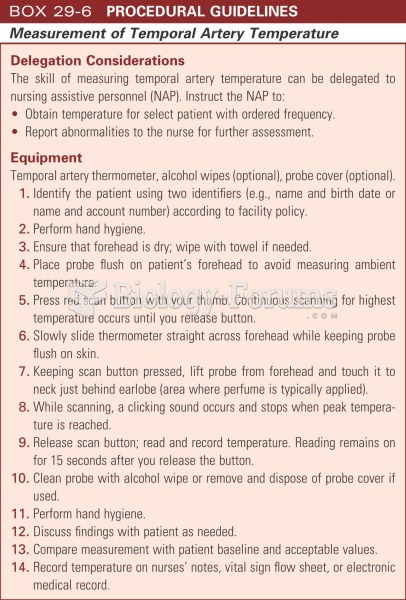 Measurement of temporal artery temperature
 In the box on upward social mobility on page 82, we discussed how Latinos face a similar situation. ...
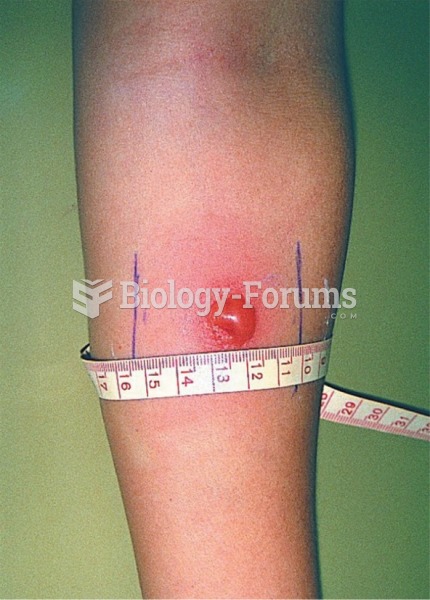 Induration measurement in a tuberculin skin test, a type IV hypersensitivity.
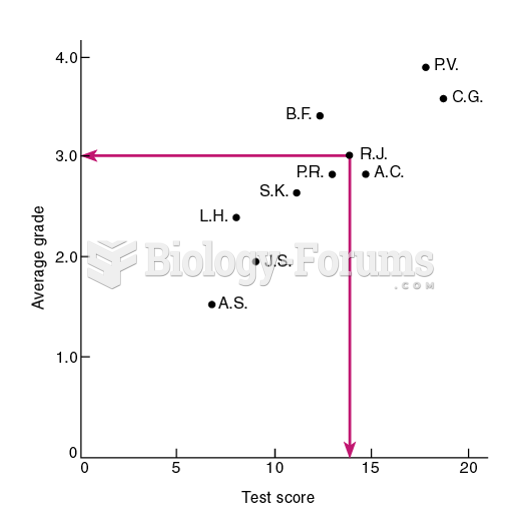 A Scatterplot of the Test Scores and Average Grades of 10 Students
 Fundal height measurement