|
|
|

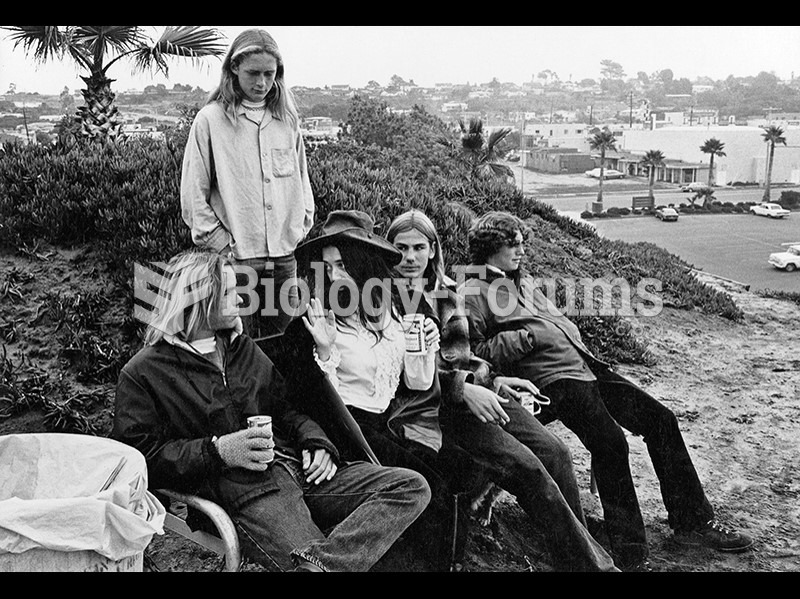 Eleanor Antin, My Kingdom Is the Right Size, from the series The King of Solana Beach.
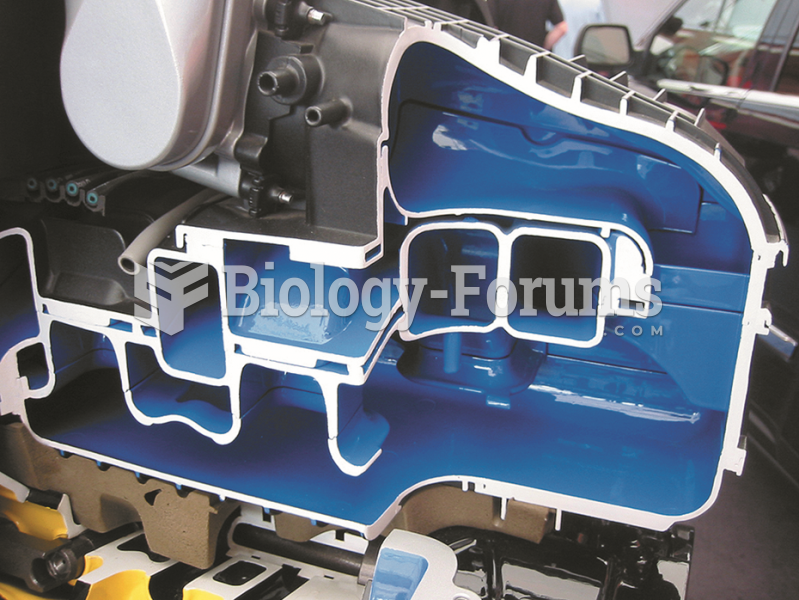 Many plastic intake manifolds are constructed using many parts glued together to form complex ...
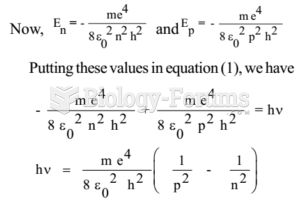 Bracket series
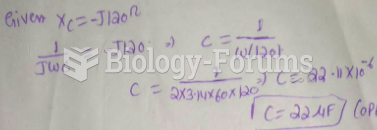 If the frequency equals 60 Hz in Figure 10-1, what is the value of capacitance?
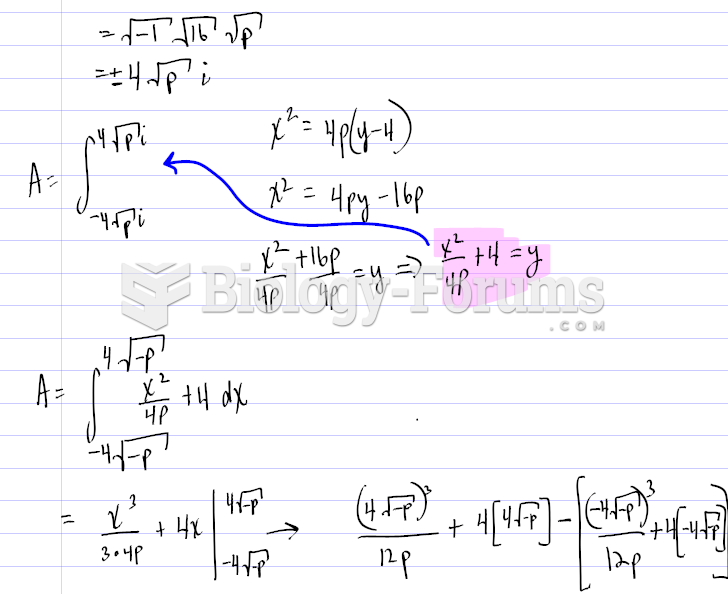 Finding the graph of a Parabola using certain values
 Trapezoidal Rule Graph