|
|
|

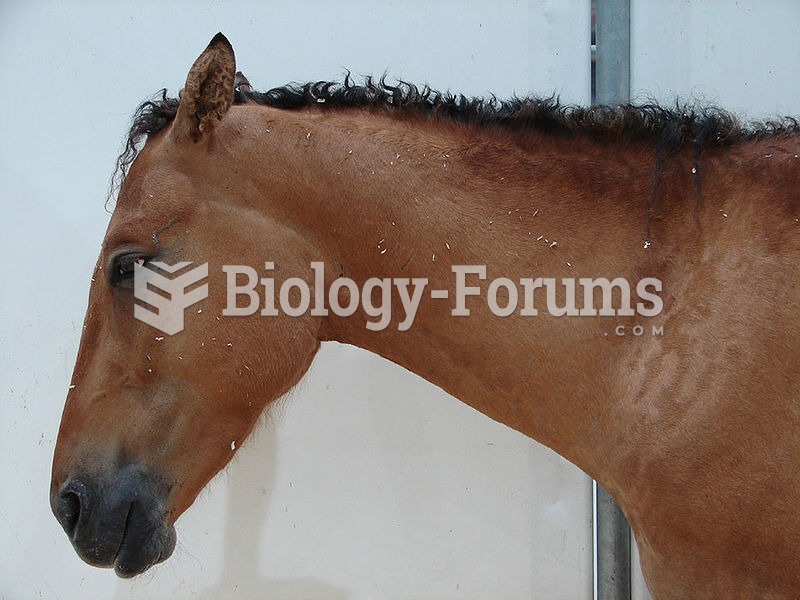 Relaxed ear position of a bored or resting horse. Lower lip is loose, also indicating relaxation. Th
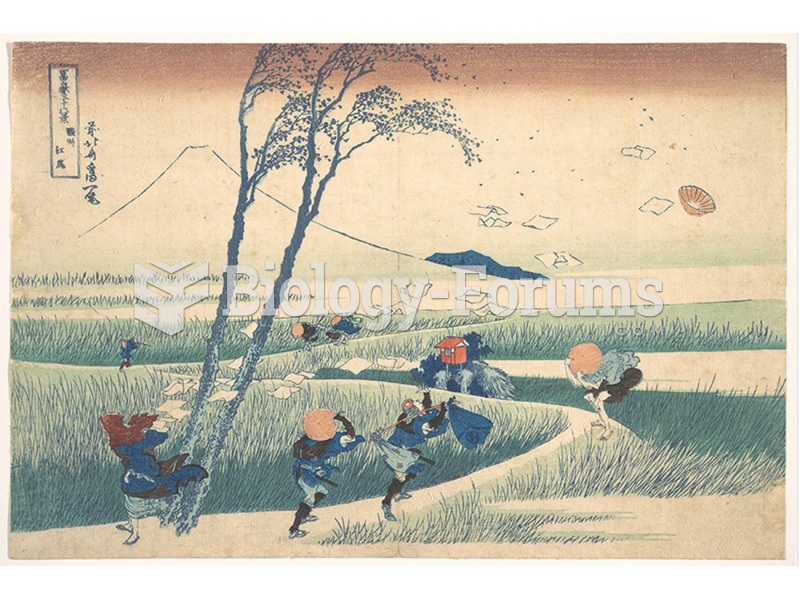 Hokusai, Sunshu Ejiri, from the series Thirty-Six Views of Mount Fuji.
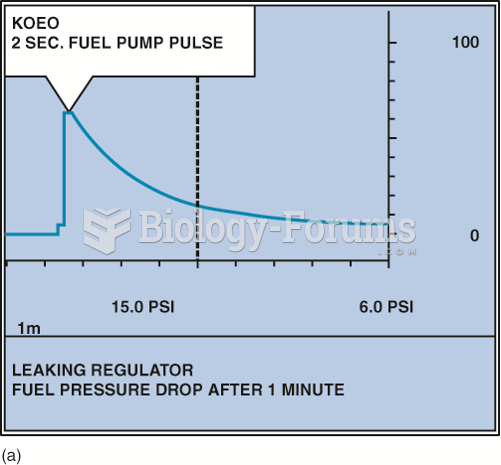 A fuel-pressure graph after key on, engine off (KOEO) on a TBI system.
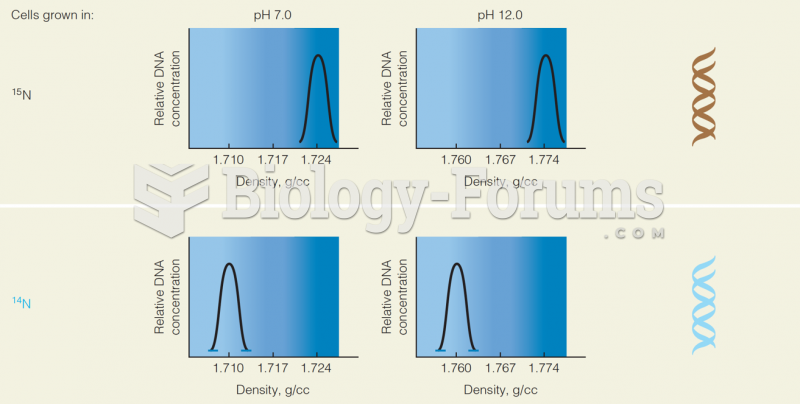 Cell Grown in 15N and 14 N: Graph of Relative DNA Concentration Vs. the Density
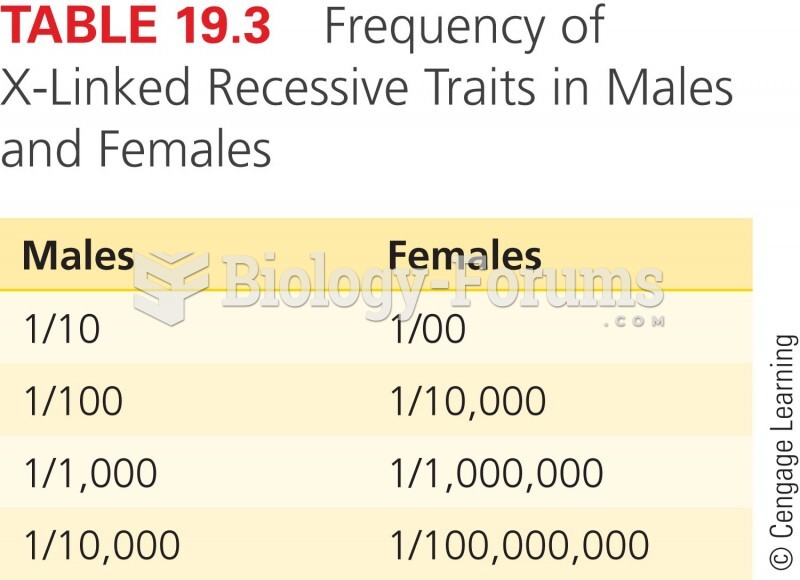 Frequency of X-Linked Recessive Traits in Males and Females
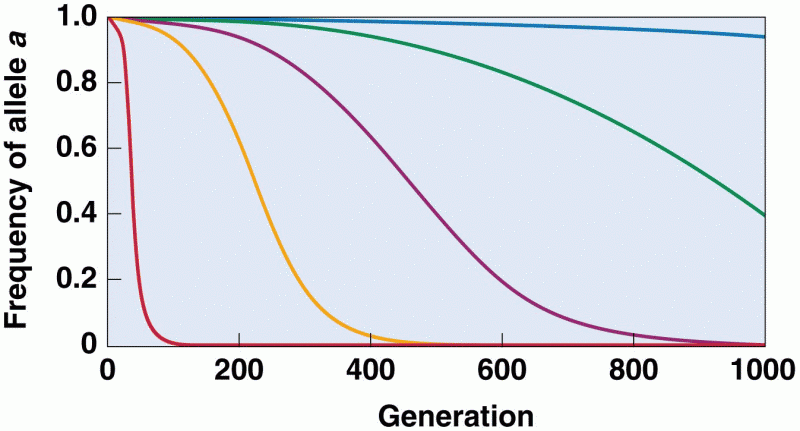 The effect of selection on allele frequency