|
|
|

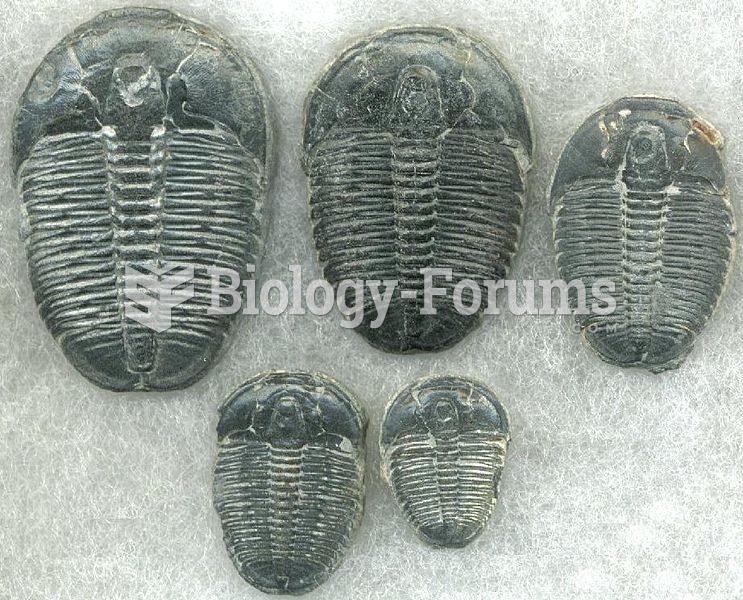 Elrathia kingii growth series with holaspids ranging from 16.2 mm to 39.8 mm in length
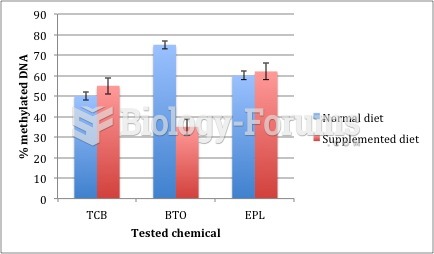 Graph of 3 compounds tested
 How to graph complex numbers
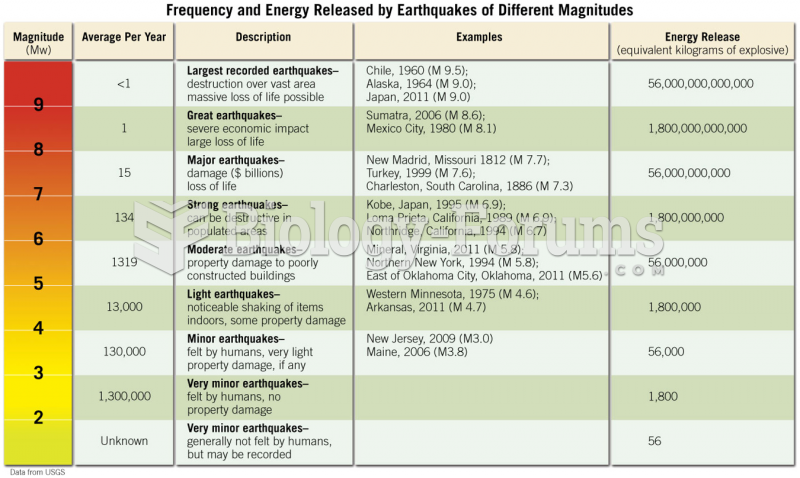 Annual Earthquake Occurrence
 Phylogenetic tree constructed by comparing homologies in cytochrome c amino acid sequences
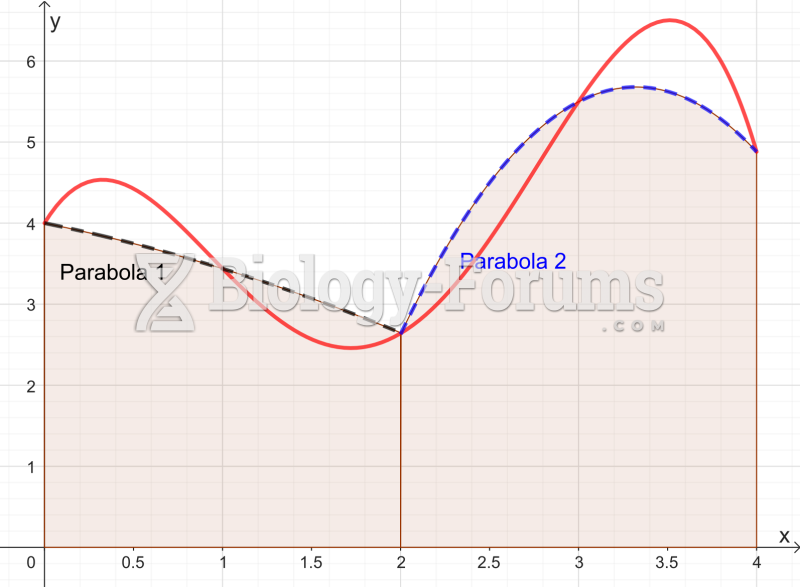 Graph approximated by two parabolas for the Simpson's rule