|
|
|

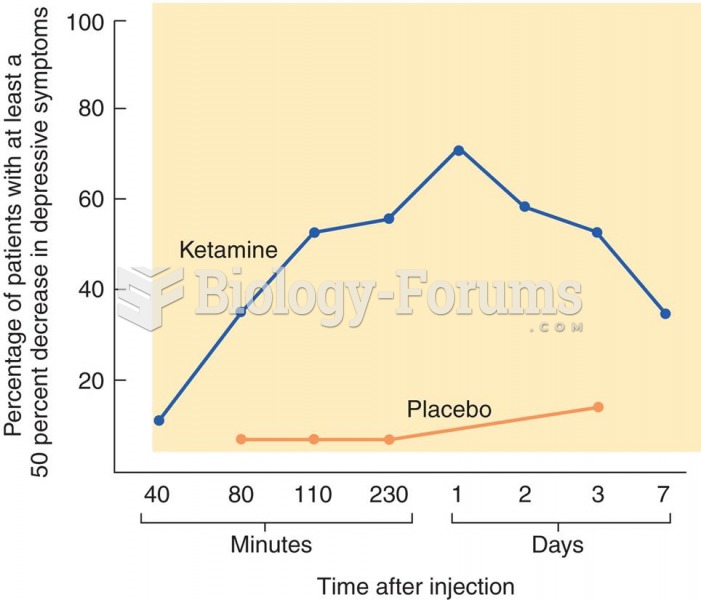 Treatment of Depression with Ketamine The graph shows the effects of ketamine on symptoms of depress
 To measure fuel-injector resistance, a technician constructed a short wiring harness with a double ...
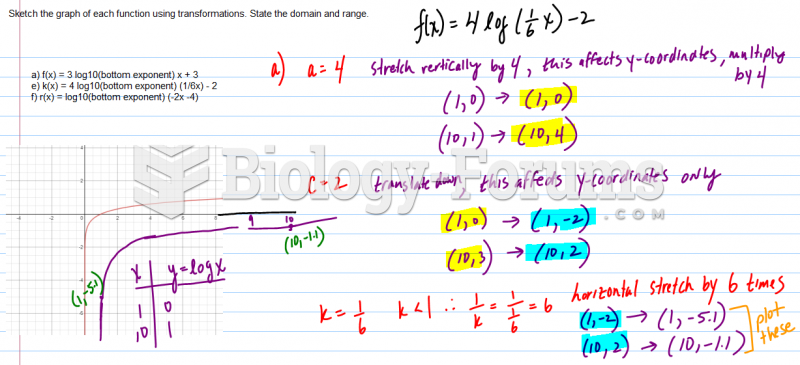 Sketch the graph of each function using transformations. State the domain and range.
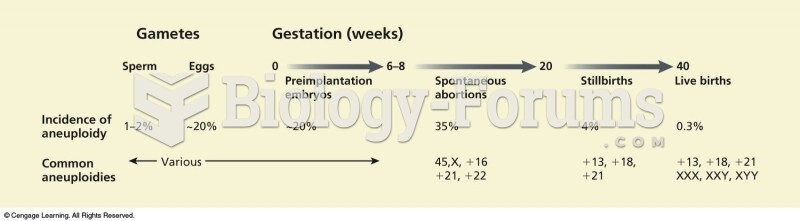 The frequency of aneuploidy changes dramatically over developmental time. Between 6 to 8 weeks and 2
 The effect of selection on allele frequency
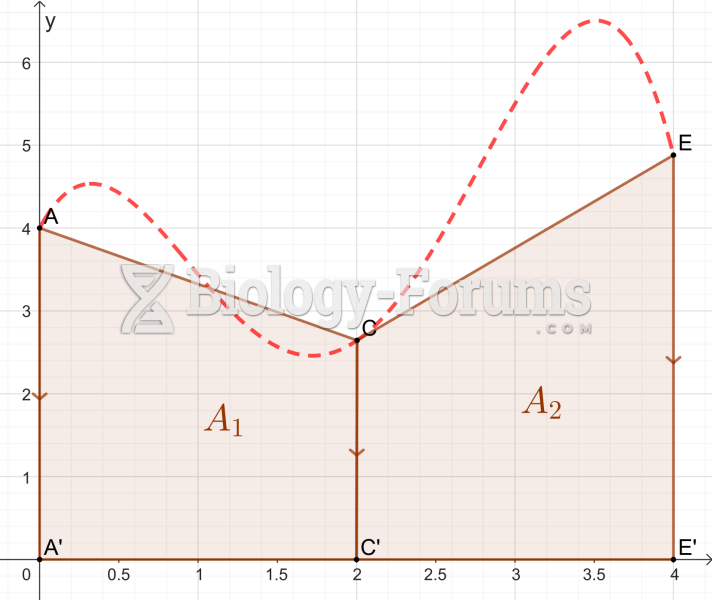 Trapezoidal rule (approximation with two rectangles)