|
|
|

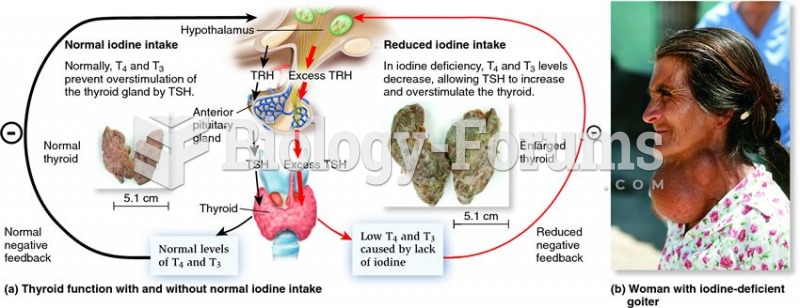 Consequences of normal and inadequate iodine in the diet.
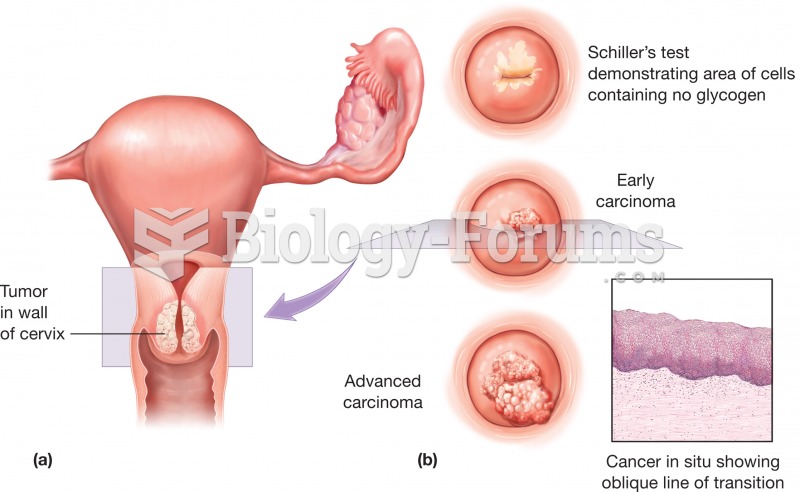 Cervical cancer (a) Top view of the uterus showing the presence of a tumor in the wall of the cervix
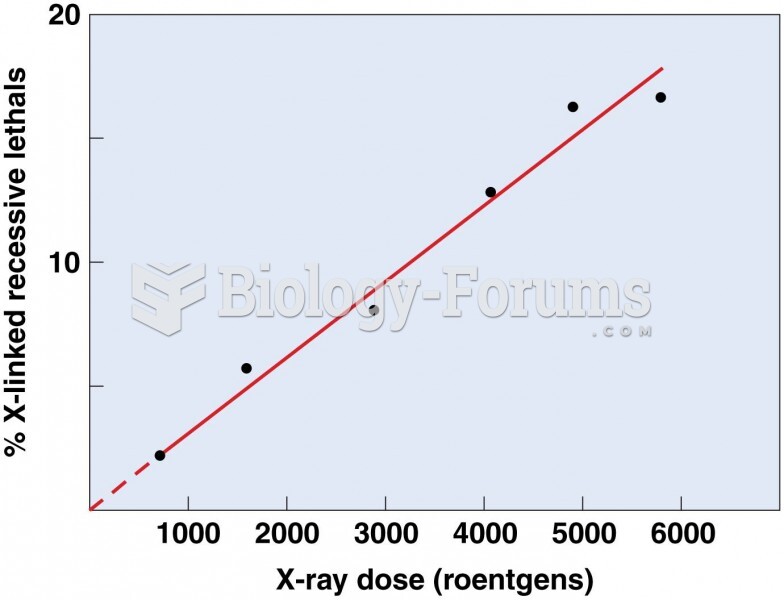 Plot of the percentage of X-linked recessive mutations
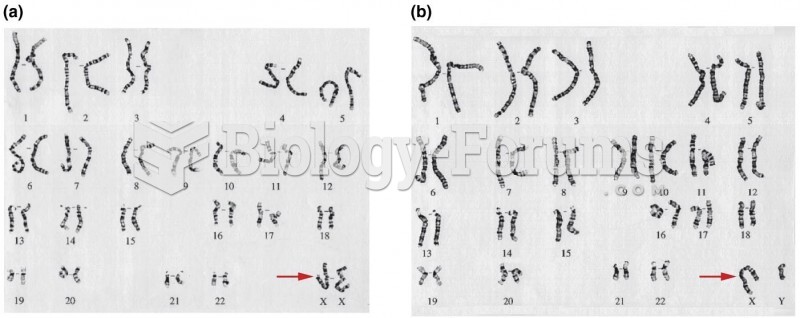 The traditional human karyotypes derived from a normal female and a normal male
 Linkage Data from 39 Families with Cystic Fibrosis
 The Hfr chromosome time-of-entry map is assembled from the recombinant data