|
|
|

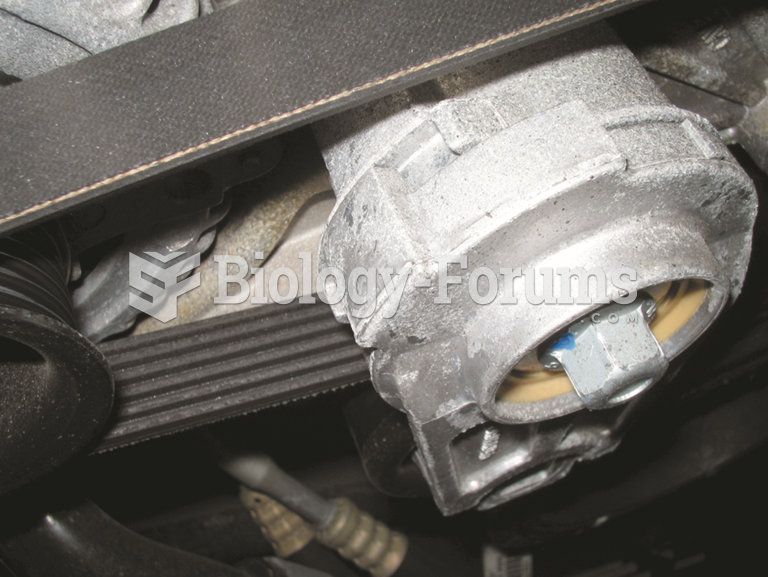 An accessory belt tensioner. Most tensioners have a mark that indicates normal operating location. ...
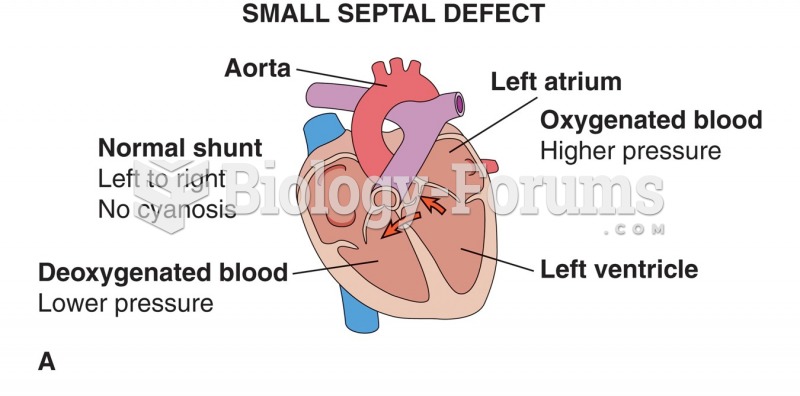 Effects of septal defects: (A) normal shunt; no cyanosis; (B) increased pressure in right ventricle; ...
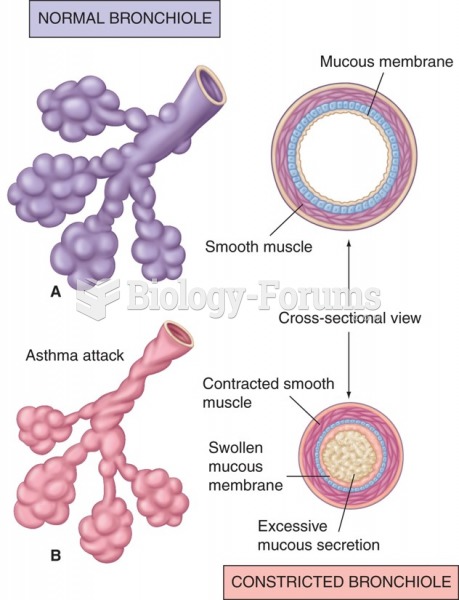 A) Normal bronchiole and (B) bronchiole constricted in asthma attack.
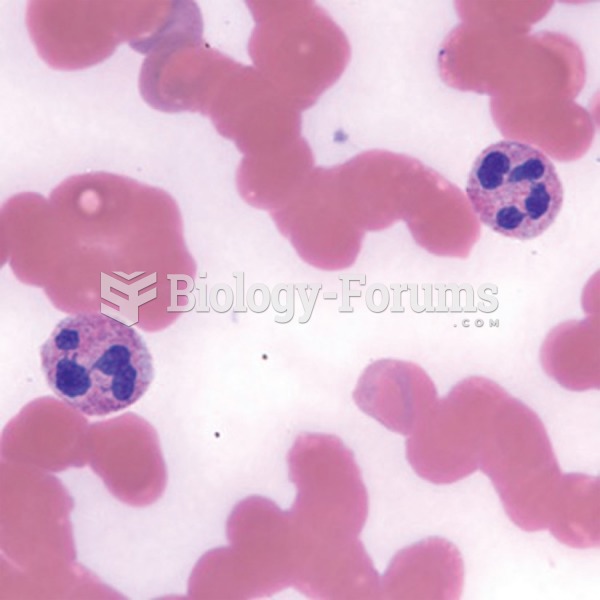 Neutrophils in a normal blood smear.
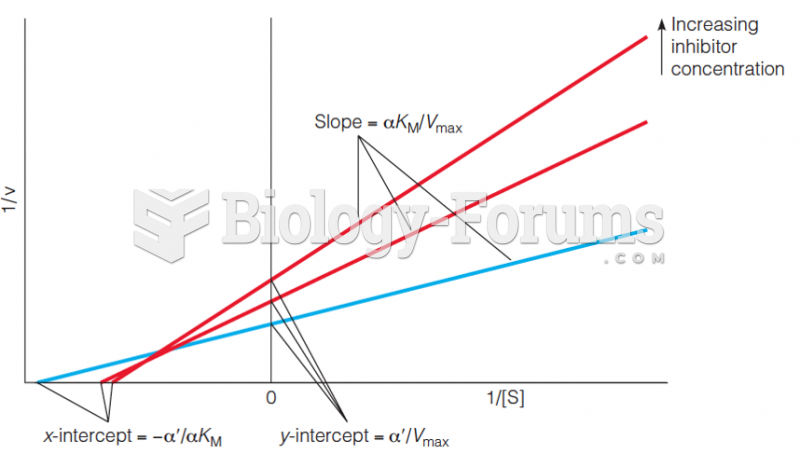 Lineweaver–Burk plot for mixed inhibition kinetics
 The Hfr chromosome time-of-entry map is assembled from the recombinant data