|
|
|

 Assessing Palpebral Conjunctiva, Everting the Eyelid
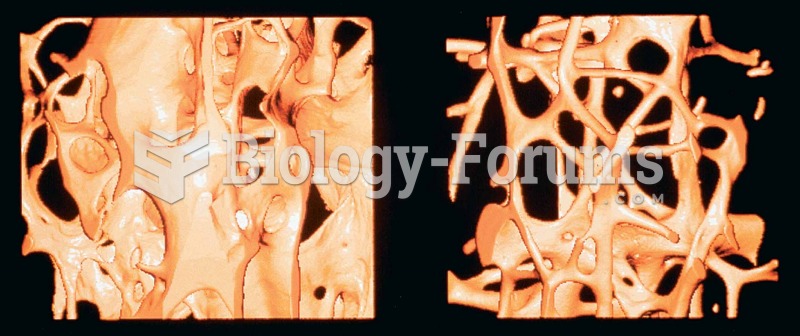 Normal bone versus bone with osteoporosis.
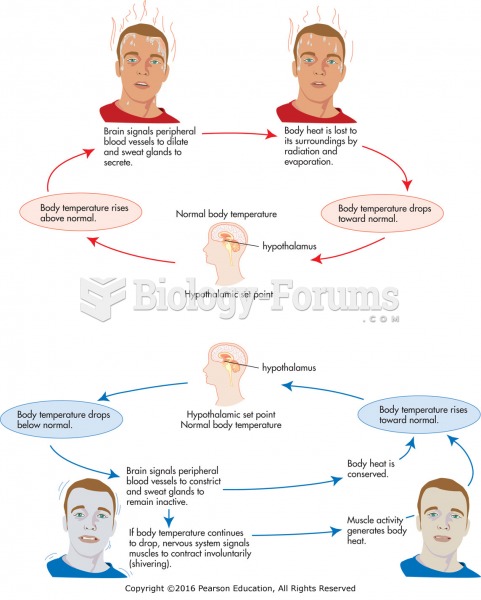 The homeostatic control of normal body temperature (37°C or 98.6°F).
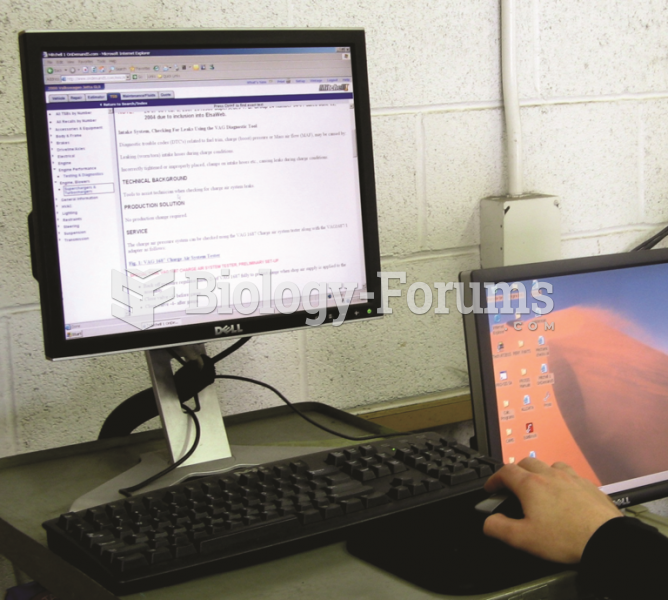 Electronic service information is available from aftermarket sources, such as All-Data and ...
 Normal and Impaired Vision
 Inferring Productivity from Data on Output and Factor Accumulation