This topic contains a solution. Click here to go to the answer
|
|
|

 Life of a Medical School Student
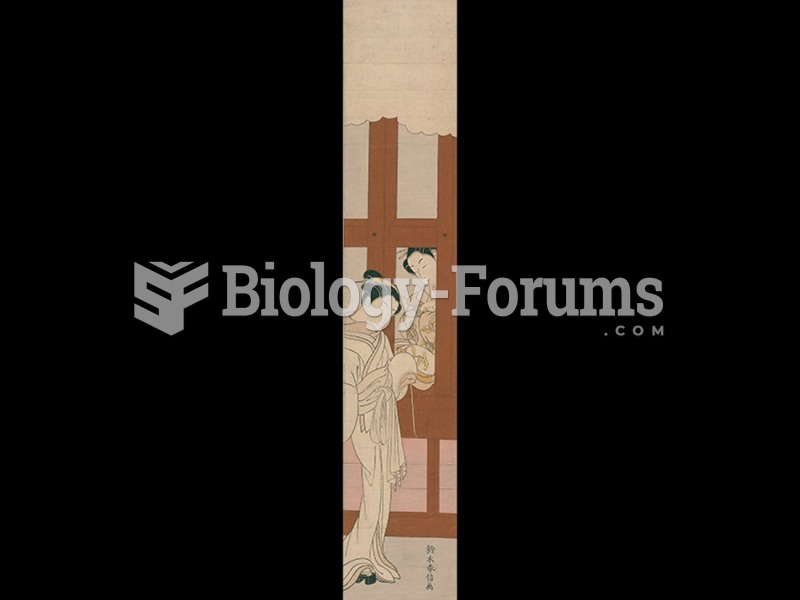 Suzuki Harunobu, Two Courtesans, Inside and Outside the Display Window.
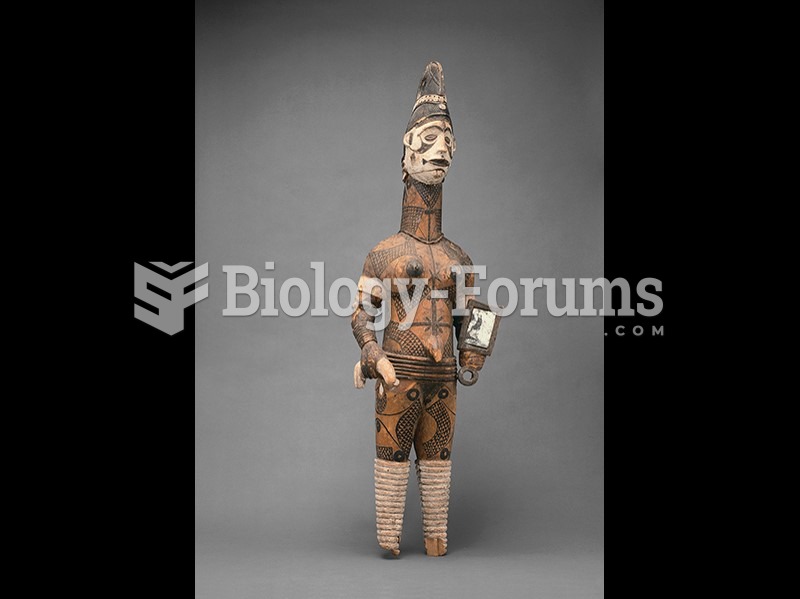 Ugonachomma display figure, Igbo, Nigeria.
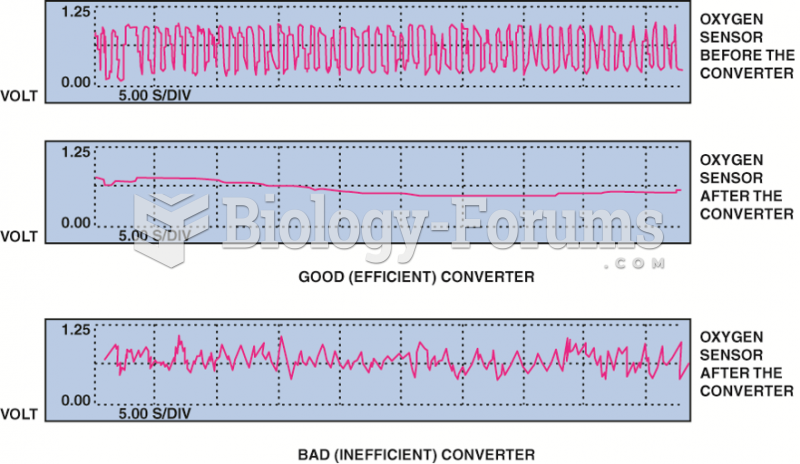 The post-catalytic converter oxygen sensor should display very little activity if the catalytic ...
 Collage of Student Faces
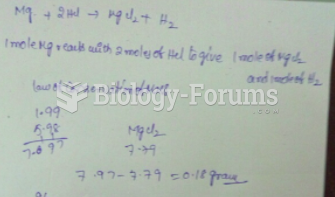 Mg can react with HCl to produce the white solid MgCl2 and H2 gas. A student mixes 1.99 g of ...