This topic contains a solution. Click here to go to the answer
|
|
|

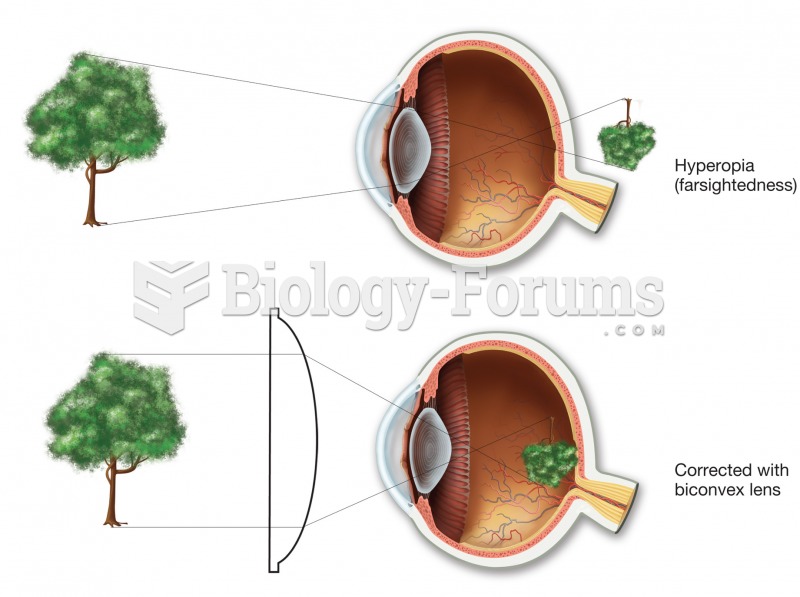 Hyperopia (farsightedness). In the uncorrected top figure, the image would come into focus behind th
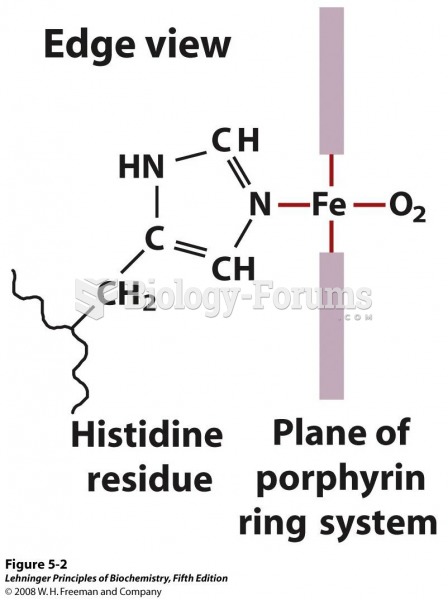 The heme group viewed from the side. This view shows the two coordination bonds to Fe2+
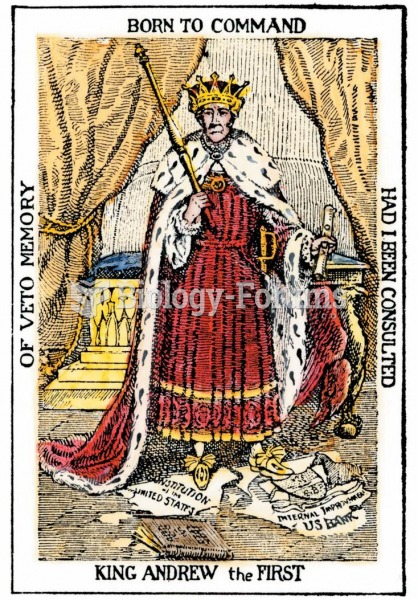 A cartoon of “King Andrew the First” shows Jackson standing atop the U.S. Constitution—a scepter in
 This image shows the spread of droplets from an uncovered sneeze.
 Blood Supply to the Lungs
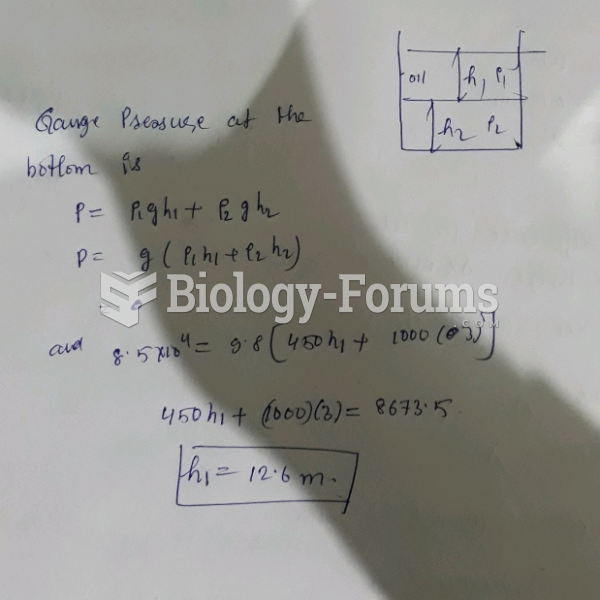 As shown in the figure, a large open tank contains a layer of oil ( density 450 kg/m3) floating ...