This topic contains a solution. Click here to go to the answer
|
|
|

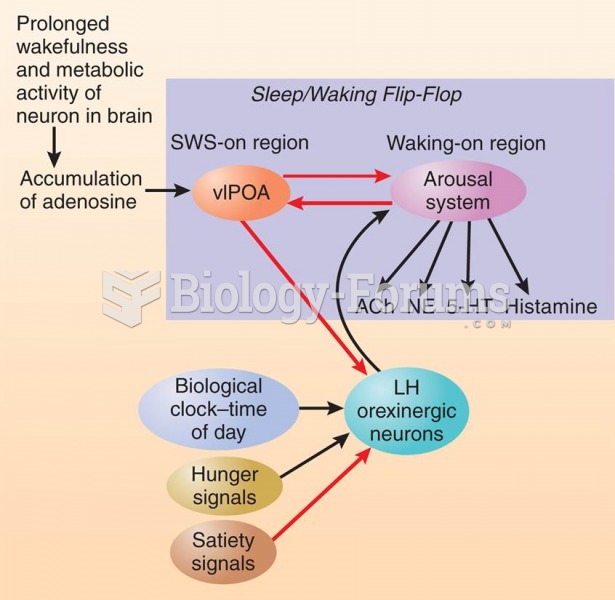 Adenosine, Time of Day, and Hunger
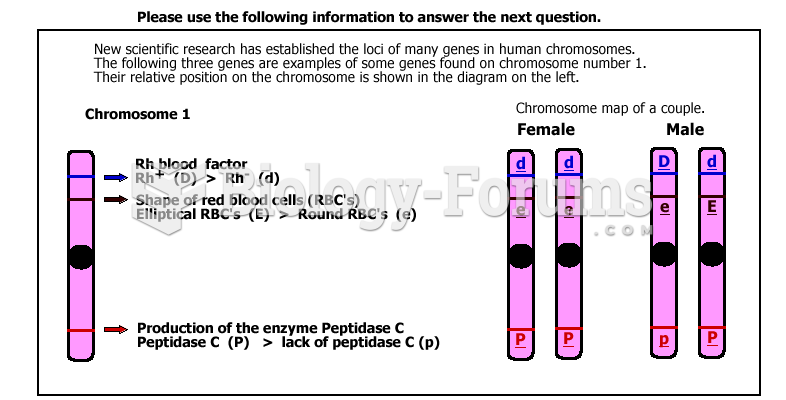 Chart to answer QN
 Greet a First-Time Client With a Firm Handshake.
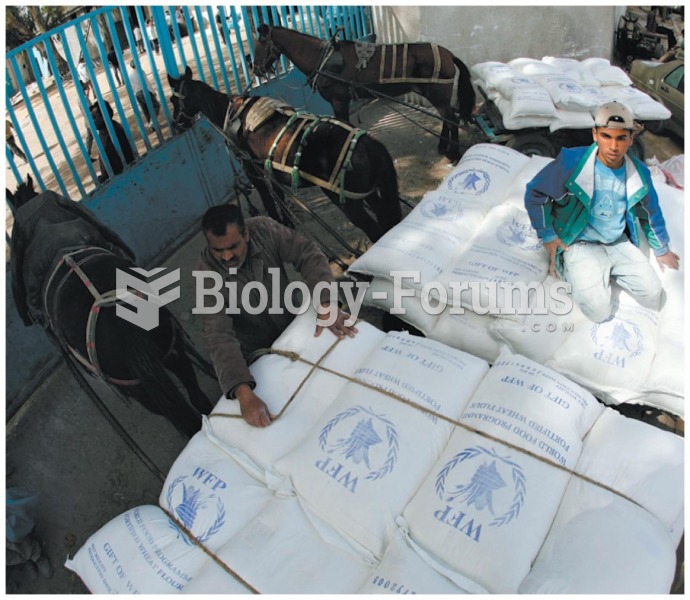 Many hunger-relief programs work to provide food aid to needy nations
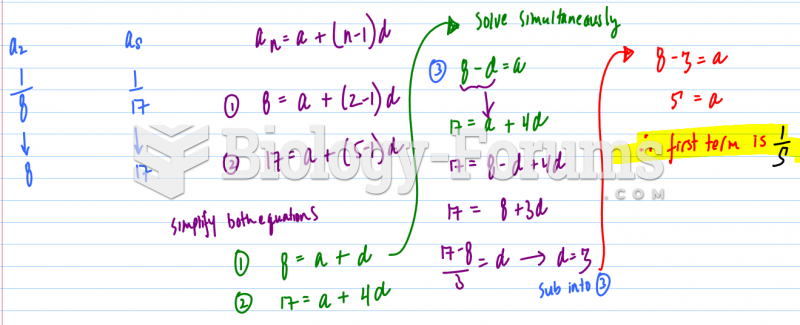
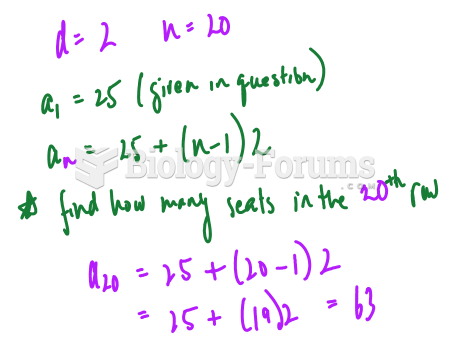 Sequence Series Arithmatic Progression Problem
 Harmonic Series Solution