Both p-charts and c-charts are designed for use when the data we are working with are referred to as attribute data.
Indicate whether the statement is true or false
Question 2
In a multiple regression model, which of the following is true?
A) The coefficient of determination will be equal to the square of the highest correlation in the correlation matrix.
B) Adding variables that have a low correlation with the dependent variable will cause the R-square value to decline.
C) The sum of the residuals computed for the least squares regression equation will be zero.
D) The adjusted R-square might be higher or lower than the value of the R-square.

 Thyroid scan. The right image is the data from a thyroid scan, printed on a superimposed map of the
 Anatomical Charts Foot and Ankle
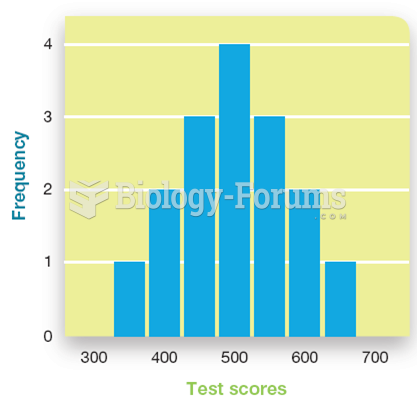 Graphing Psychological Data
 A compression gauge designed for the higher compression rate of a diesel engine should be used when ...
 The data link connector (DLC) can be located in various locations.
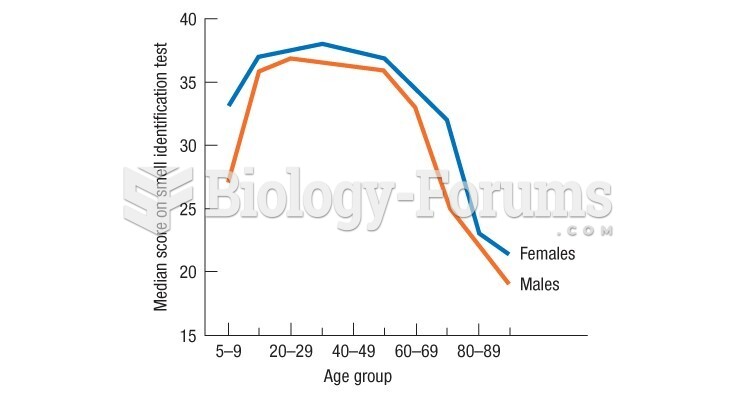 Doty's data show a very rapid drop in late adulthood in the ability to identify smells