Both p-charts and c-charts are designed for use when the data we are working with are referred to as attribute data.
Indicate whether the statement is true or false
Question 2
In a multiple regression model, which of the following is true?
A) The coefficient of determination will be equal to the square of the highest correlation in the correlation matrix.
B) Adding variables that have a low correlation with the dependent variable will cause the R-square value to decline.
C) The sum of the residuals computed for the least squares regression equation will be zero.
D) The adjusted R-square might be higher or lower than the value of the R-square.

 Areas of Referred Pain, Posterior View
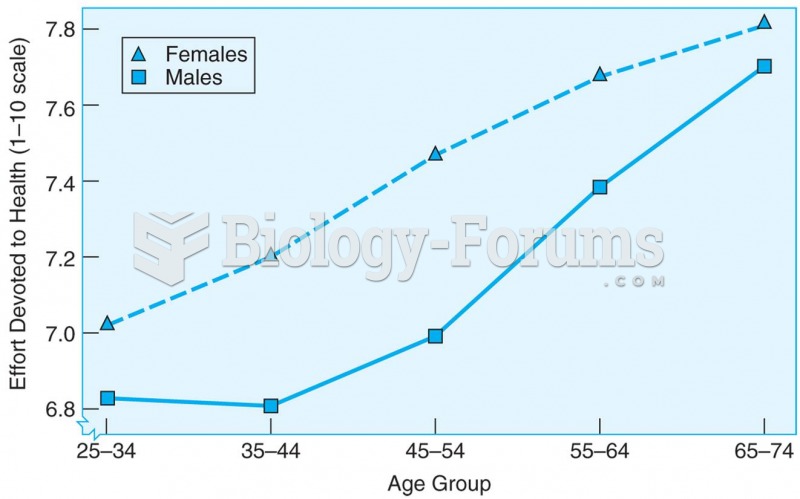 Cross-sectional data showing that the amount of effort spent on personal health care increases with
 Phyllis Schlafly drew much of her support from working-class women who were left vulnerable by the ...
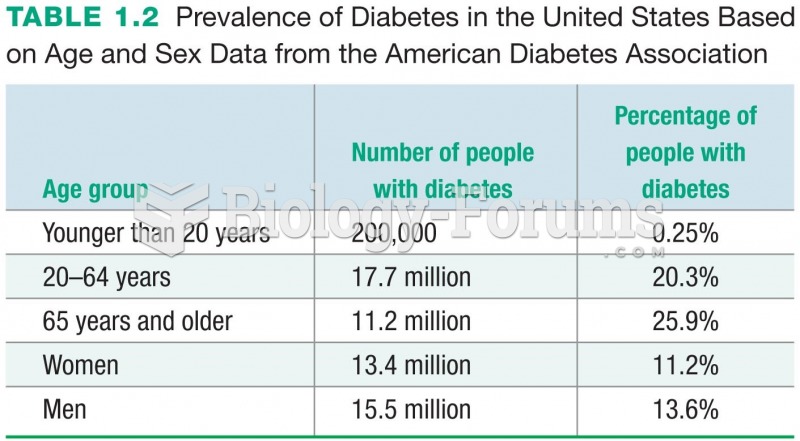 Prevalence of Diabetes in the United States Based on Age and Sex Data from the American Diabetes ...
 The fuel injectors used on this Honda Civic GX CNG engine are designed to flow gaseous fuel instead ...
 Demographic Data for India