This topic contains a solution. Click here to go to the answer
|
|
|

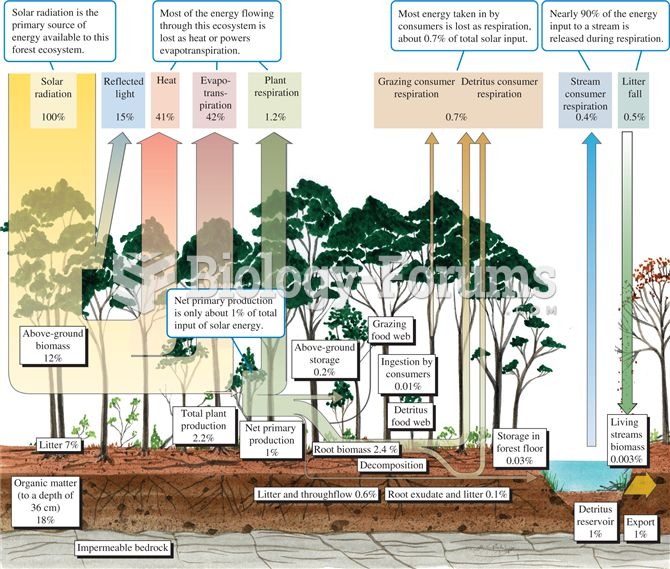 Energy budget for a temperate deciduous forest (data from Gosz et al. 1978).
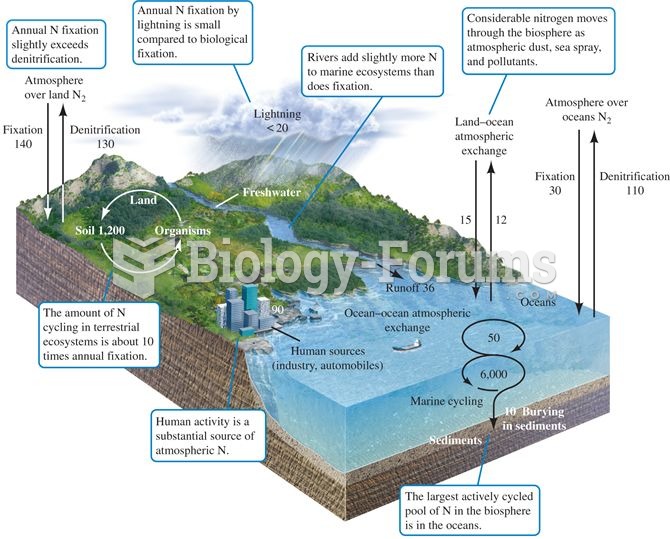 The nitrogen cycle. Numbers represent fluxes as 1012 g N per year (data from Schlesinger 1991, after
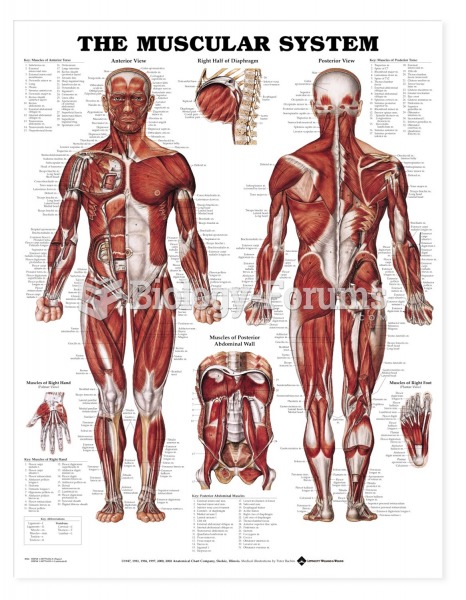 Anatomical Charts Muscular System
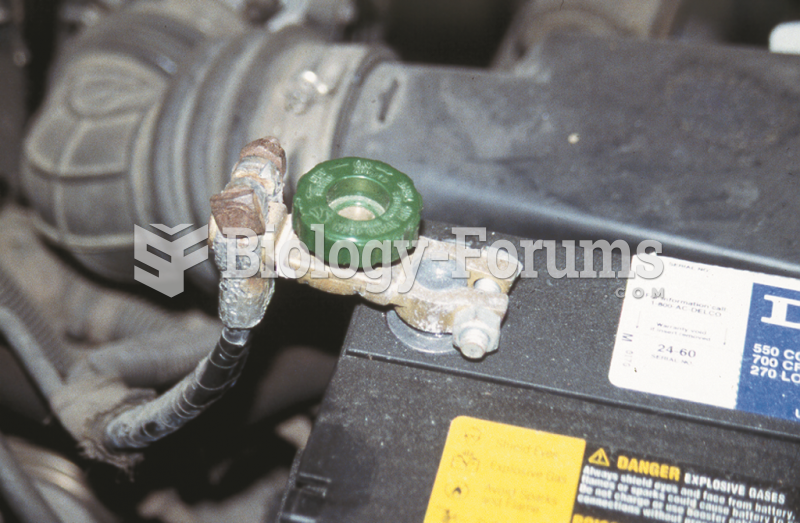 After connecting the shutoff tool, start the engine and operate all accessories. Stop the engine ...
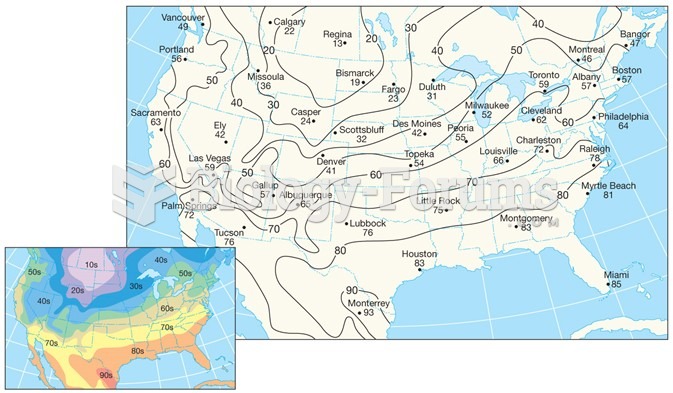 Air-Temperature Data
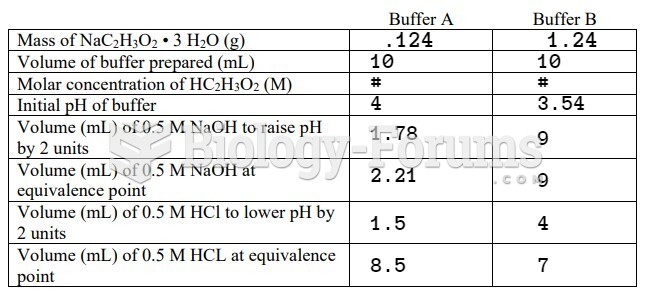 data
data