This topic contains a solution. Click here to go to the answer
|
|
|

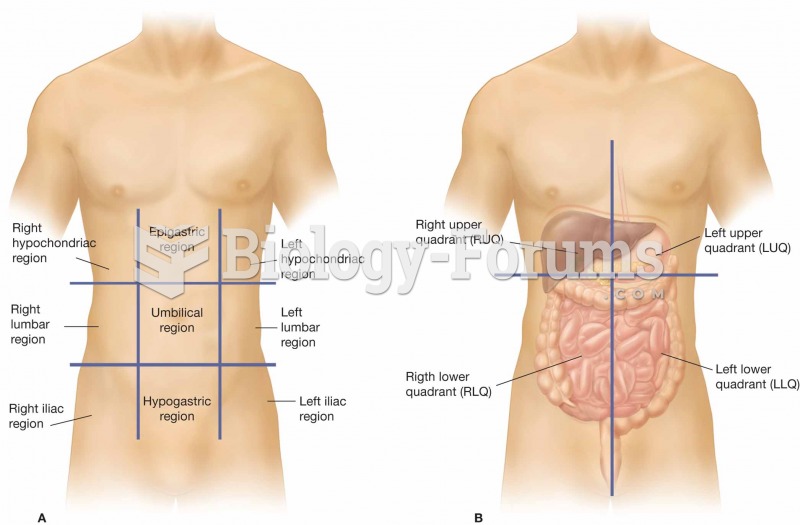 (A) The nine regions of the abdominopelvic cavity. (B) The four regions of the abdomen, which are re
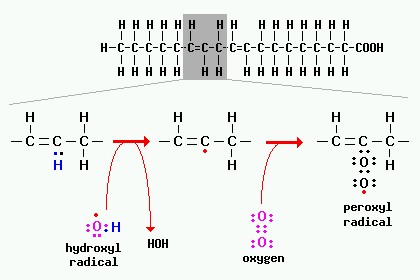 A peroxidation reaction involving a fatty acid is depicted in the figure below.
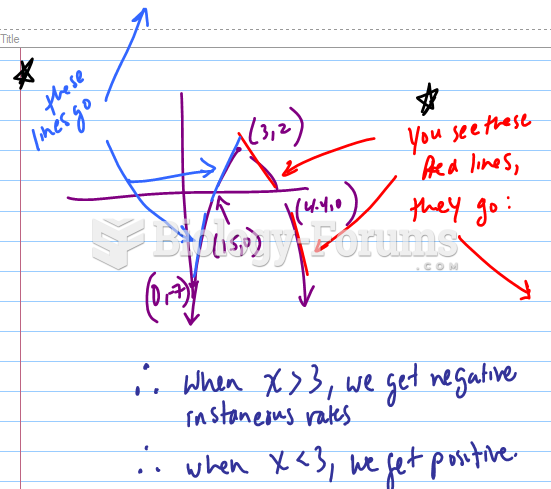 If a graph has the following x-intercepts, which value of x is the instantaneous rate of change ...
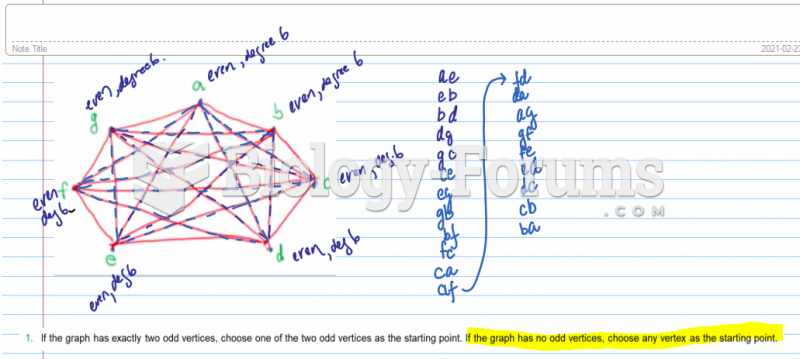 Use Fleury’s algorithm to determine Euler Circuit in the following graph. Exhibit exactly one ...
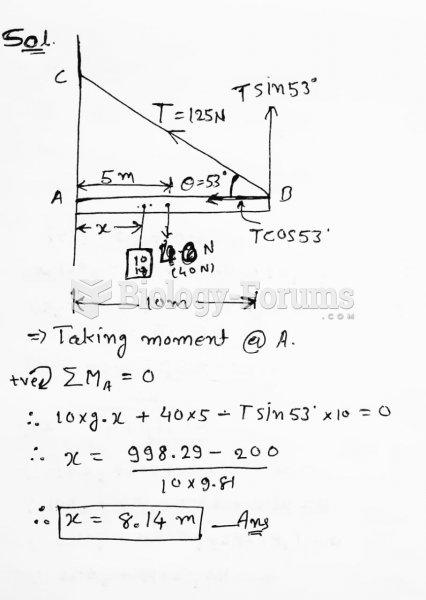 In the figure, a 10.0-m long bar is attached by a frictionless hinge to a wall and held ...
 Lod Score Values for the Families in Figure 5.15