|
|
|

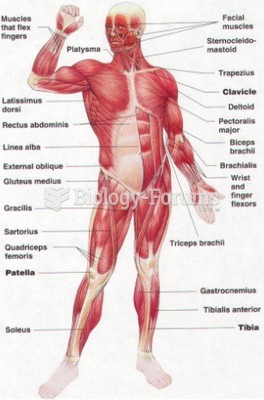 front muscle figure
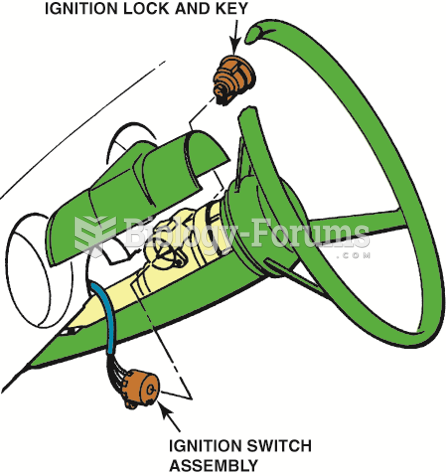 Some column-mounted ignition switches act directly on the contact points, whereas others use a link ...
 How to find the equation of a line passing through two points
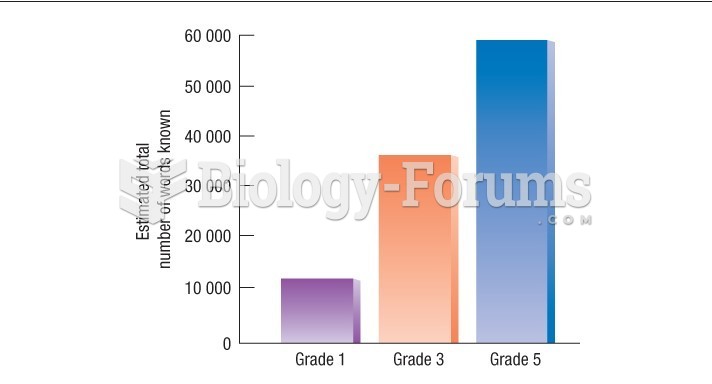 Anglin's estimates of the total vocabulary of children in Grades 1, 3, and 5
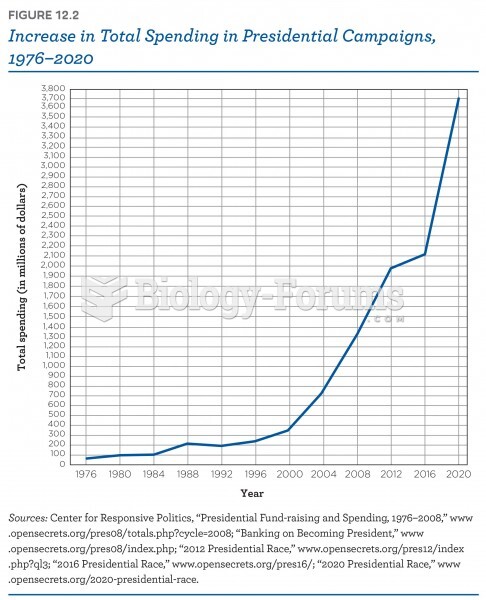 Increase in total spending in presidential campaigns, 1976-2020
 Lod Score Values for the Families in Figure 5.15