|
|
|

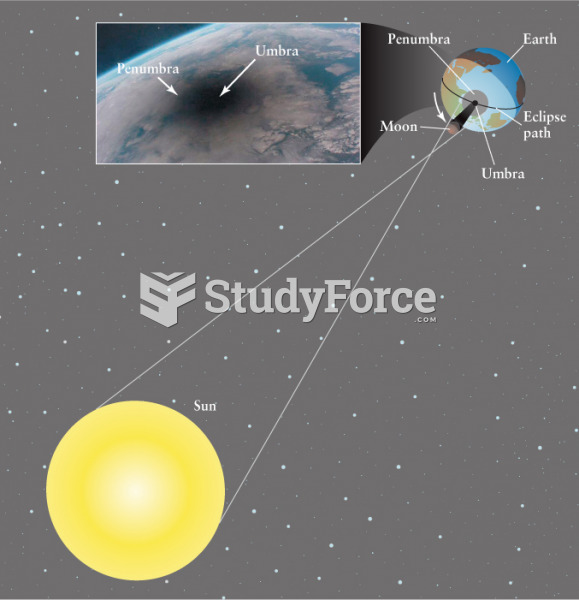 The Geometry of a Total Solar Eclipse
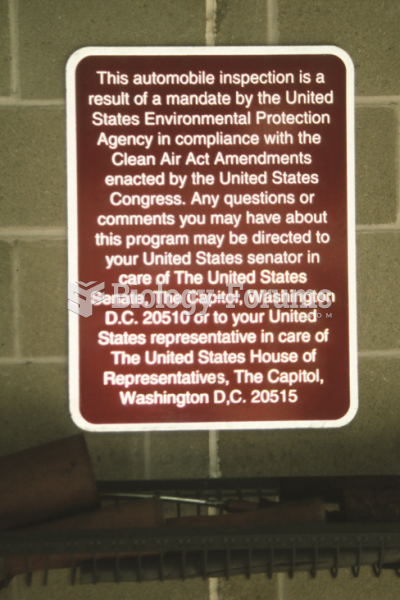 Photo of a sign taken at an emissions test facility.
 Two items from the incomplete-pictures test. H.M.’s memory for the 20 items on the test was ...
 Positive ring precipitin test.
 Figure of a Woman with a Drawing Showing Evidence of Original Painting and Outlining Design Scheme
 Compression Test: Compression Gauge