|
|
|

 Catalase Test
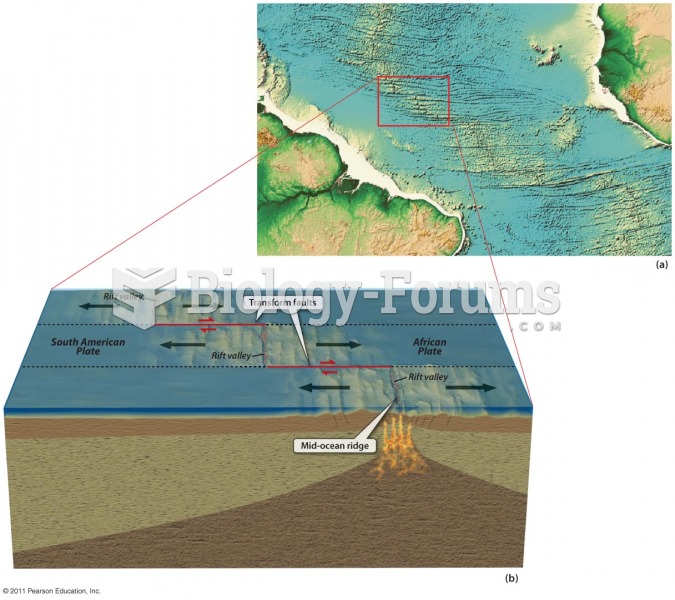 Earthquakes—Another Test For Plate Tectonics
 Mobilize each metatarsal–phalangeal joint with figure-8s. Hold the tarsal just below the ...
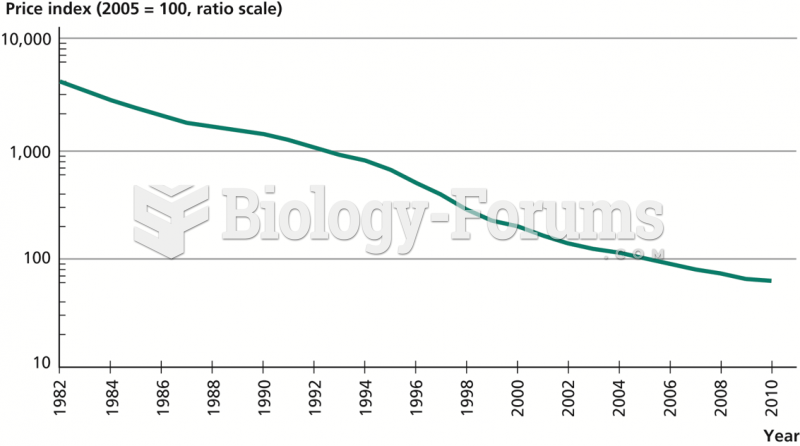 Price of Computers, 1982–2010
 Performing the Trendelenburg’s test: Applying tourniquet
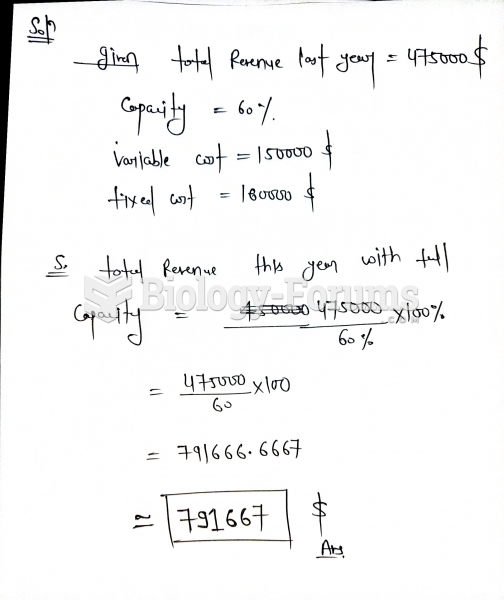 Last year, Terrific Copying had total revenue of $475 000, while operating at 60% of capacity. ...