|
|
|

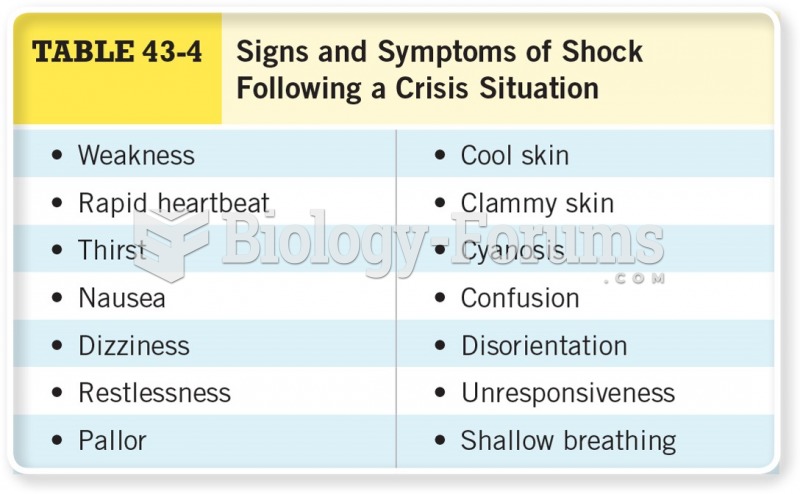 Signs and Symptoms of Shock Following a Crisis Situation
 For millions of people, the United States represents a land of opportunity and freedom from ...
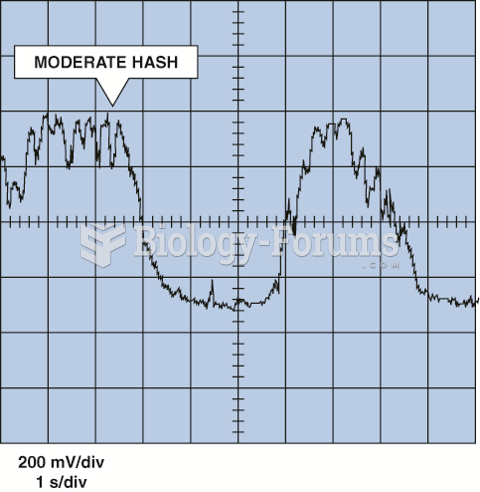 Moderate hash may or may not be significant for diagnosis.
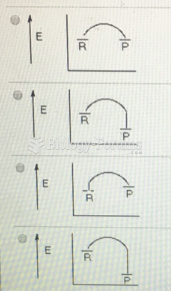 Which of the following represents a reaction coordinate diagram for a chemical reaction whose ...
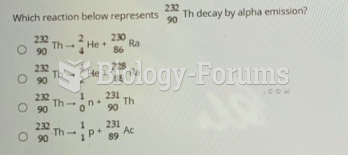 Which reaction below represents Th decay by alpha emission?
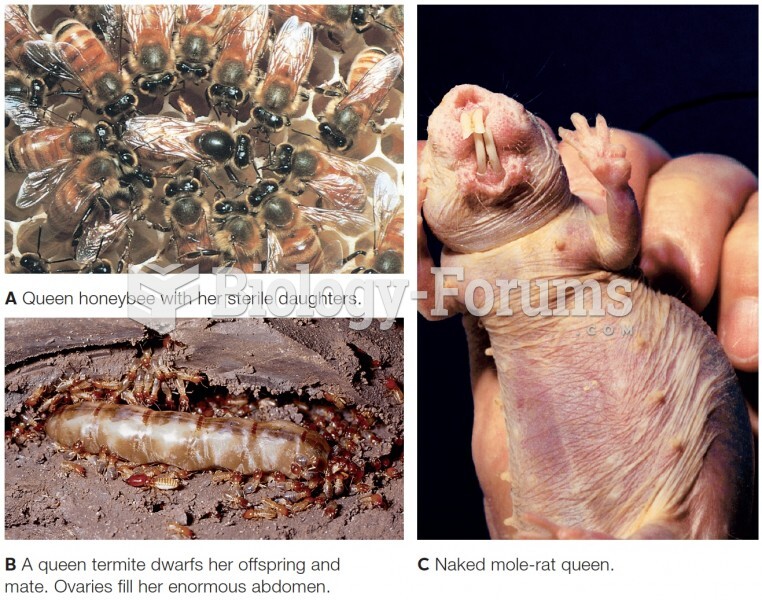 Three queens, fertile females in species that have a reproductive division of labor.