This topic contains a solution. Click here to go to the answer
|
|
|

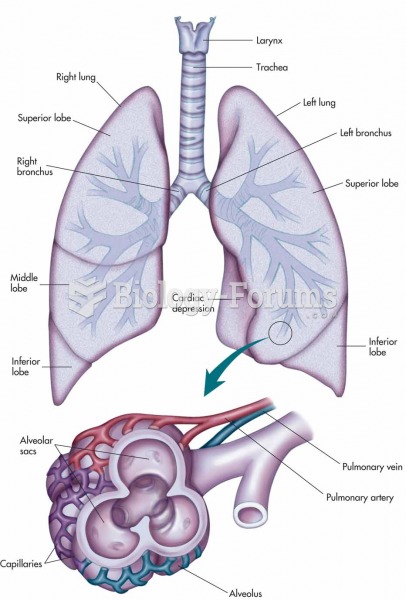 Larynx, trachea, bronchi, and lungs with an expanded view showing the structures of an alveolus and
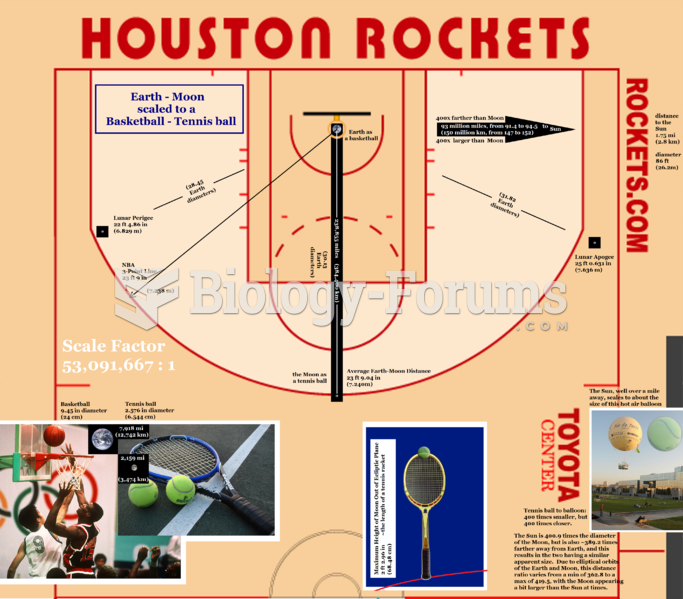 Scaling the Earth down to the size of a basketball, the Moon is roughly the size of a tennis ball. T
 McBurney point.
 POWER POINT PRESENTATION logo
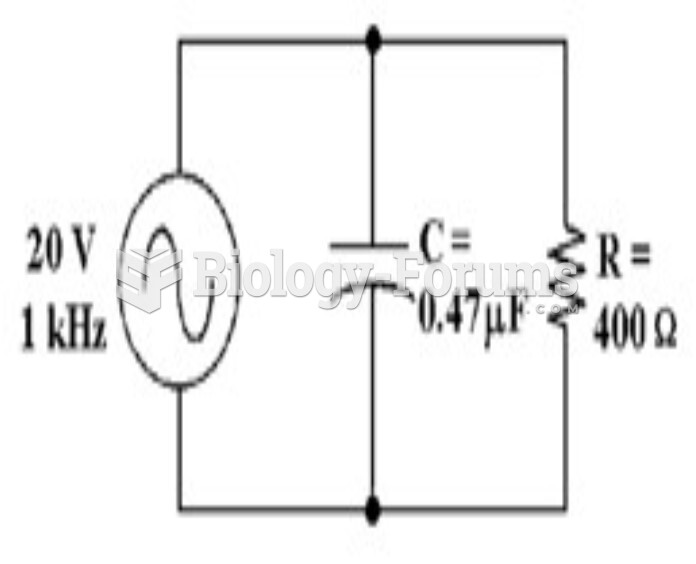 How much voltage does the resistor drop in Figure 10-2?
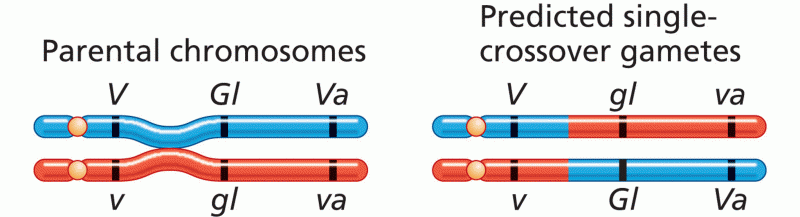 Constructing a Three-Point Recombination Map