This topic contains a solution. Click here to go to the answer
|
|
|

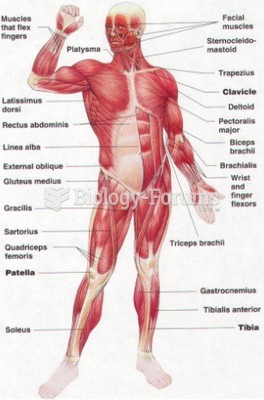 front muscle figure
 Mobilize each metatarsal–phalangeal joint with figure-8s. Hold the tarsal just below the ...
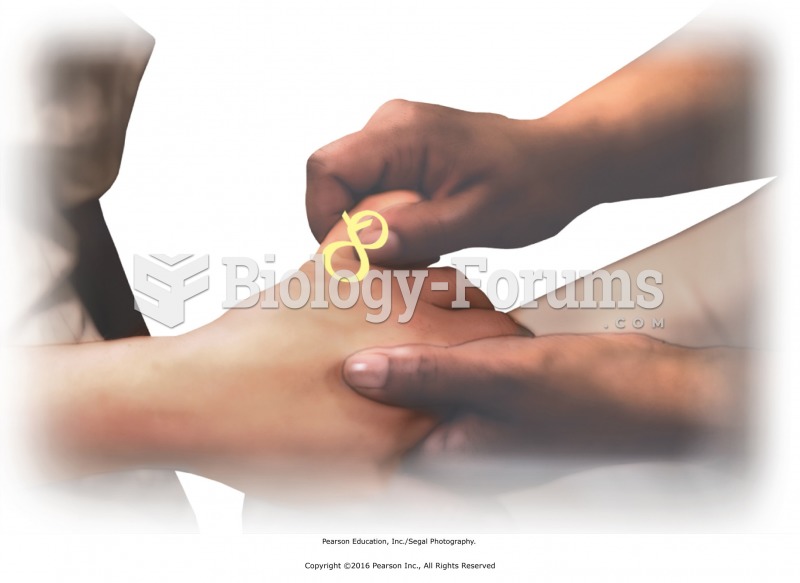 Joint movement of the fingers. Apply scissoring at the knuckles and figure-8s to the fingers to ...
 Direct thumb pressure to a trigger point.
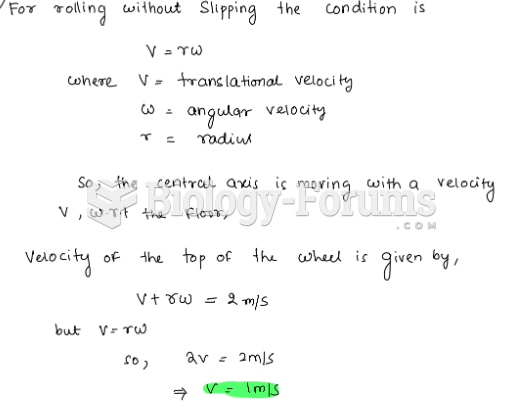 A wheel of diameter 0.70 m rolls on the floor without slipping. A point at the top of the wheel ...
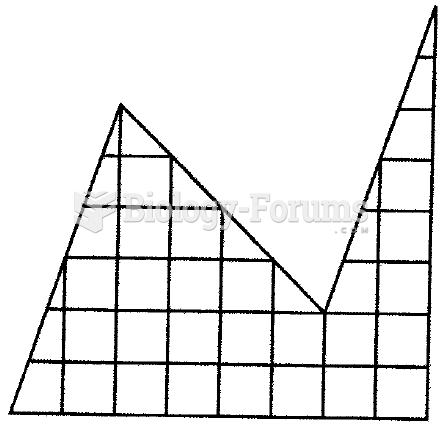 Cut the figure into two identical parts