This topic contains a solution. Click here to go to the answer
|
|
|

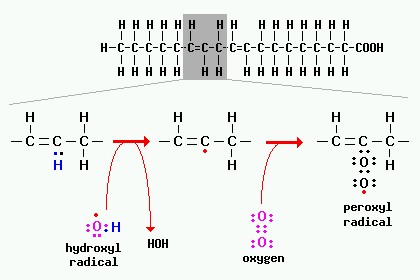 A peroxidation reaction involving a fatty acid is depicted in the figure below.
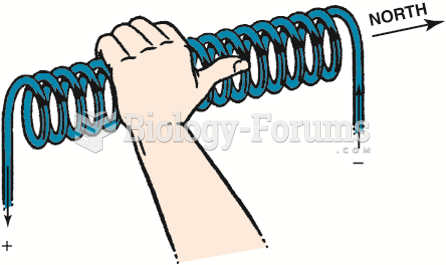 The left-hand rule states that if a coil is grasped with the left hand, the fingers will point in ...
 Write the equation in general form of the line passing through the point
 How to find the equation of a line that is parallel to a line passing through a point
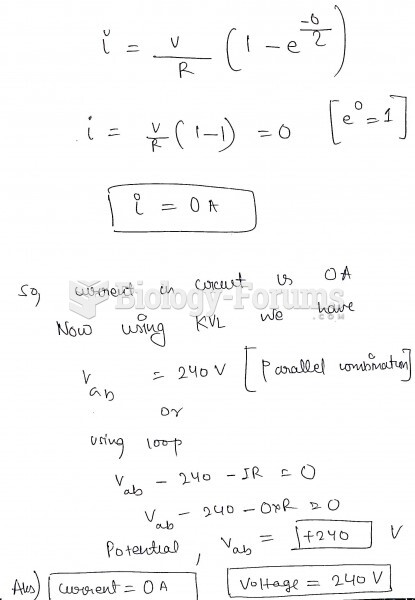 The figure shows an LR circuit with a switch and a 240-volt battery. At the instant the switch ...
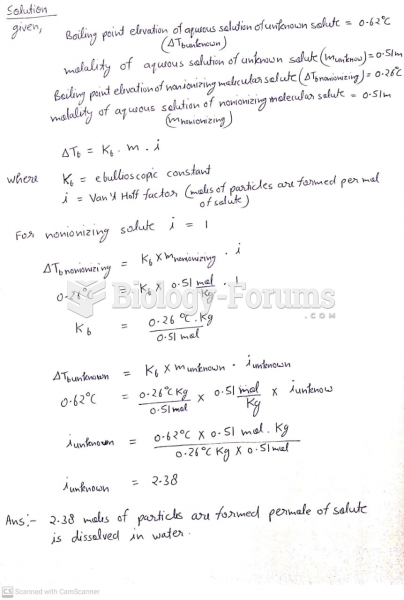 A 0.51 m aqueous solution of an unknown solute has a boiling point elevation of 0.62°C. The ...