This topic contains a solution. Click here to go to the answer
|
|
|

 Richard Rodriguez represents millions of immigrants—not just those of Latino origin but those from ...
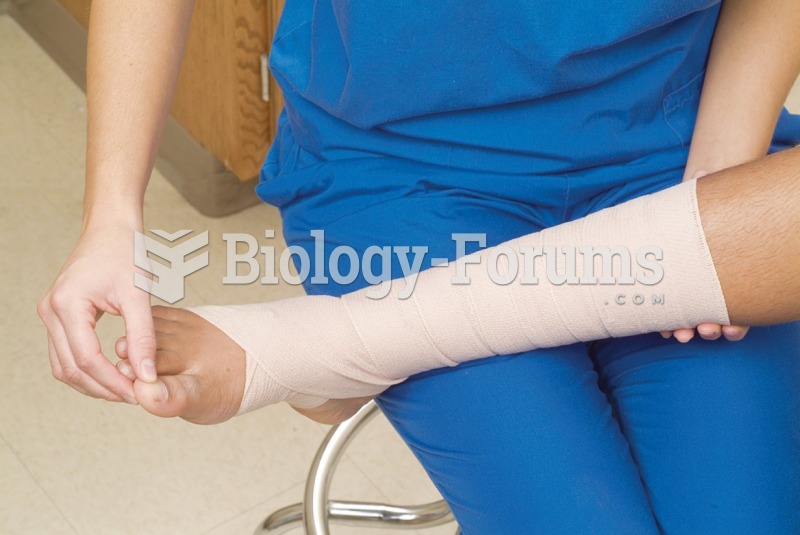 Demonstrate the Application of Triangular, Figure-Eight, and Tubular Bandages
 Decimal Point Place Values
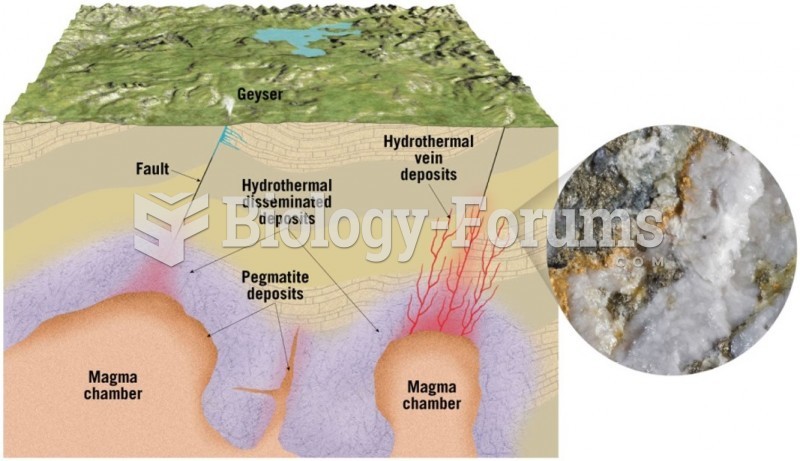 Resources from Rocks and Minerals
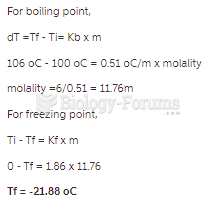 An aqueous solution has a normal boiling point of 103.0C. What is the freezing point of this ...
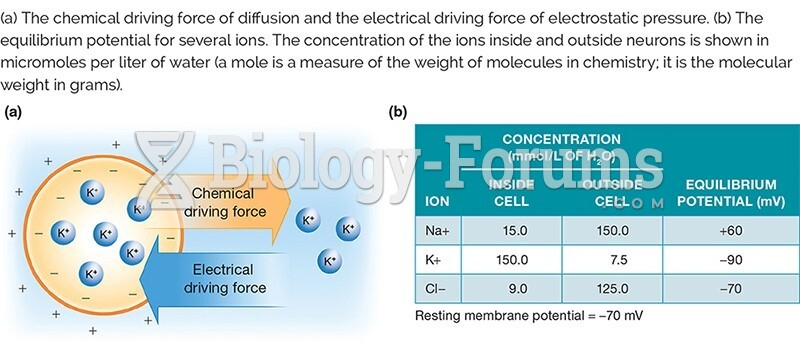 Figure 2.15.jpg