This topic contains a solution. Click here to go to the answer
|
|
|

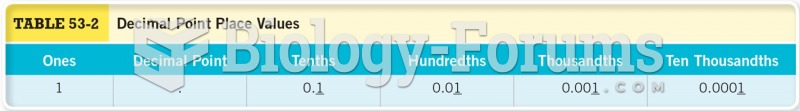 Decimal Point Place Values
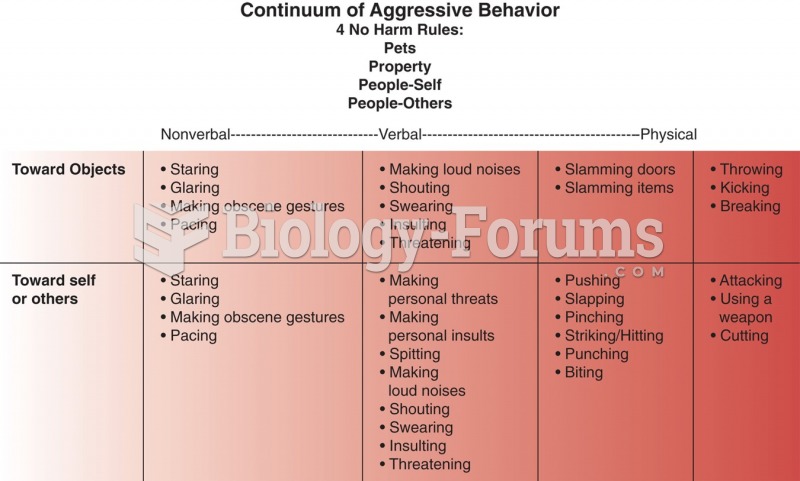 Continuum of aggression. Based on an unpublished figure by Joanne DeSanto Iennaco.
 The leaky-barrel model: a settling-point model of eating and body weight homeostasis.
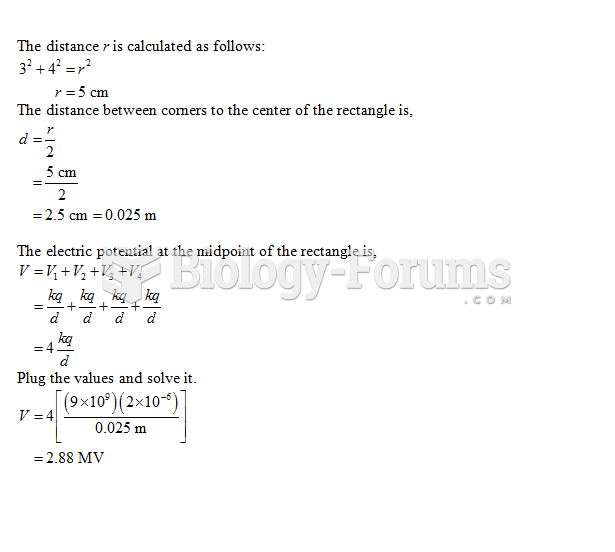 Four 2.0-µC point are at the corners of a rectangle with sides of length 3.0 cm and 4.0 cm. ...
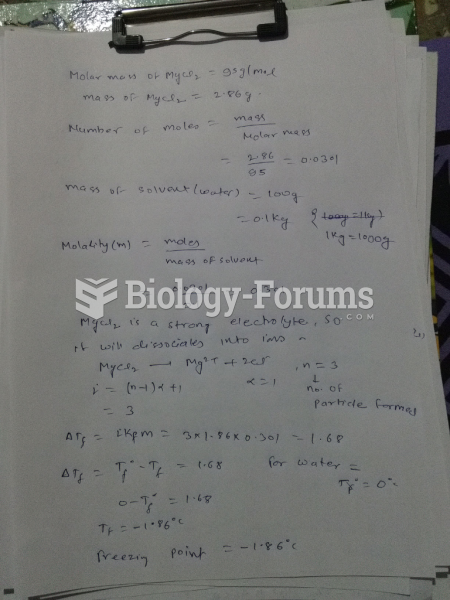 What is the freezing point of a solution of 2.86 g MgCl2 in 100 g of water? Kf for water is ...
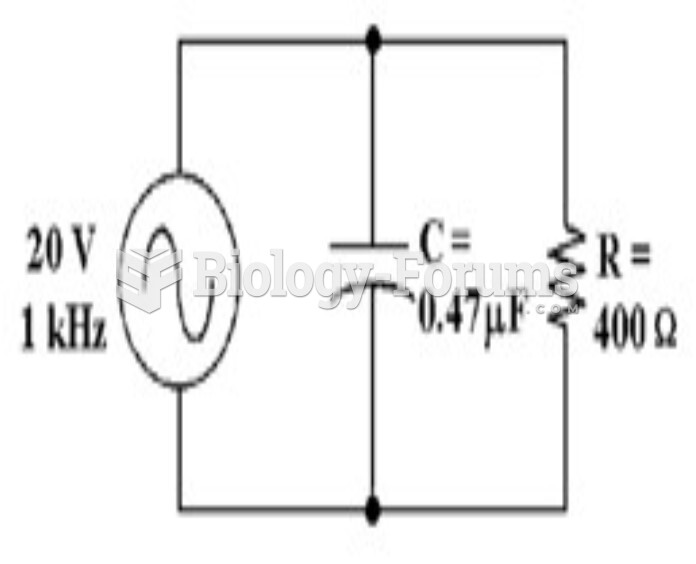 How much voltage does the resistor drop in Figure 10-2? a. 59 mV b. 19.94 V c. 20 V d. 10 V