This topic contains a solution. Click here to go to the answer
|
|
|

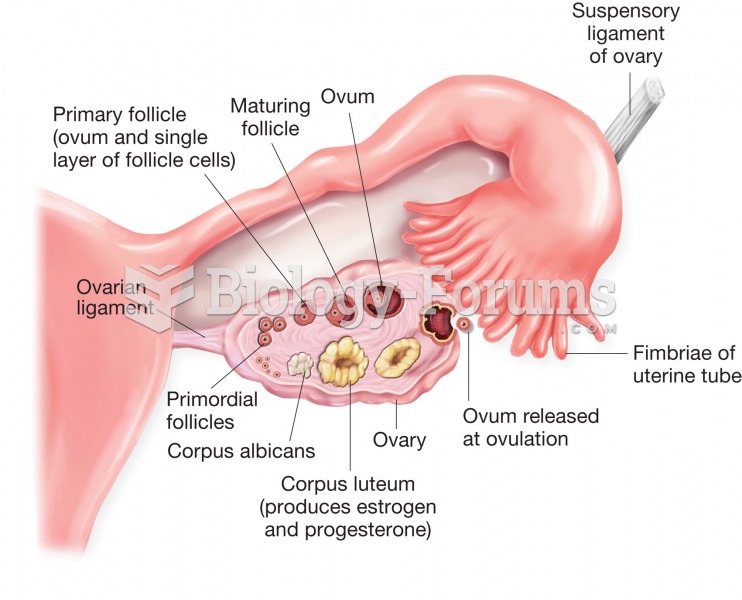 Structure of the ovary and uterine (fallopian) tube. Figure illustrates stages of ovum development a
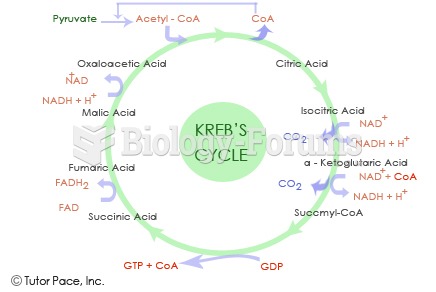 Krebs Cycle Diagram
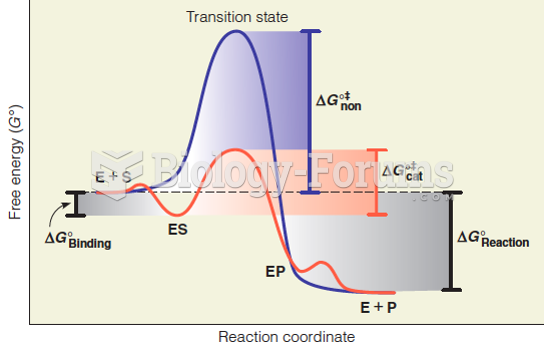 Reaction coordinate diagram for a simple enzyme catalyzed reaction
 Many countries do not produce enough food and need to import food from the United States
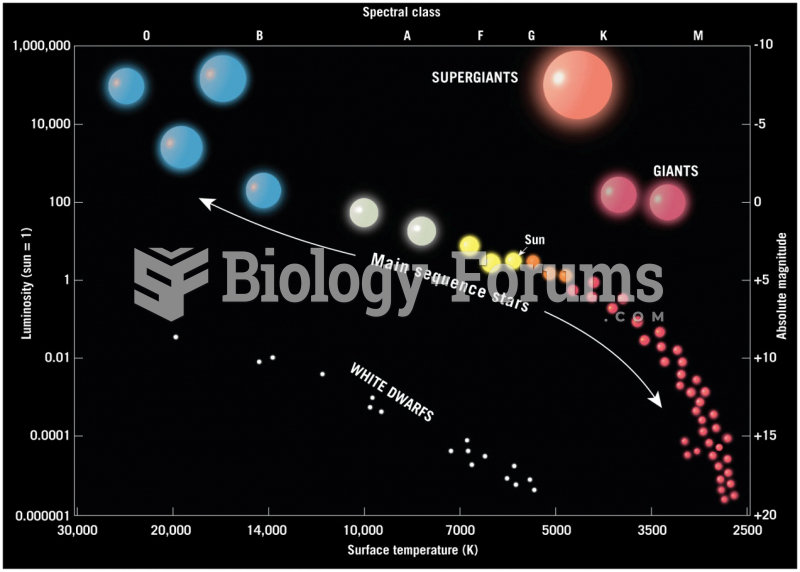 Hertzsprung-Russell Diagram
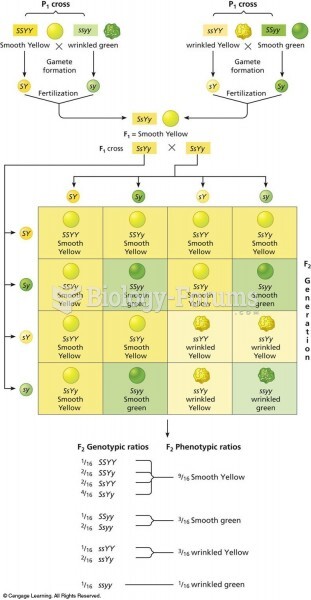 Punnett square of the dihybrid cross shown in Figure 3.8. There are two combinations of dominant and