This topic contains a solution. Click here to go to the answer
|
|
|

 Diagram of a cell nucleus
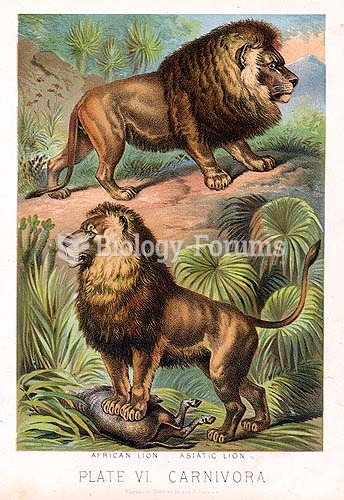 African (above) and Asiatic (below) lions, as illustrated in Johnsons Book of Nature
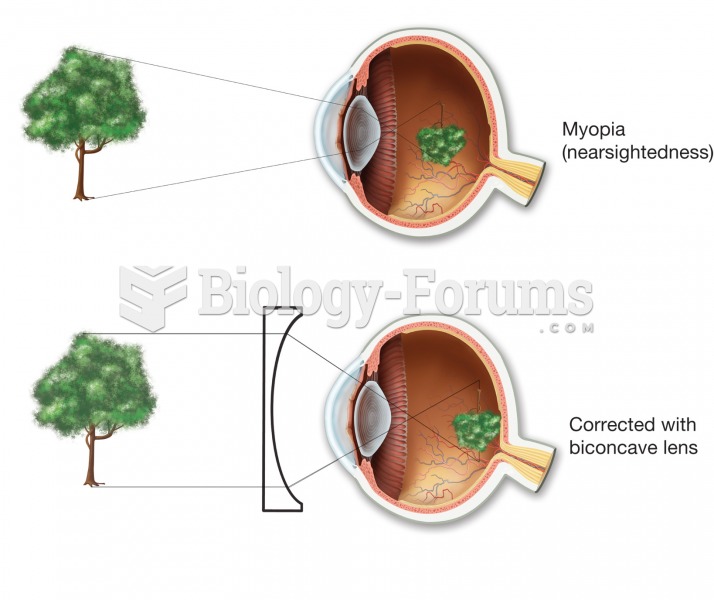 Myopia (nearsightedness). In the uncorrected top figure, the image comes into focus in front of the
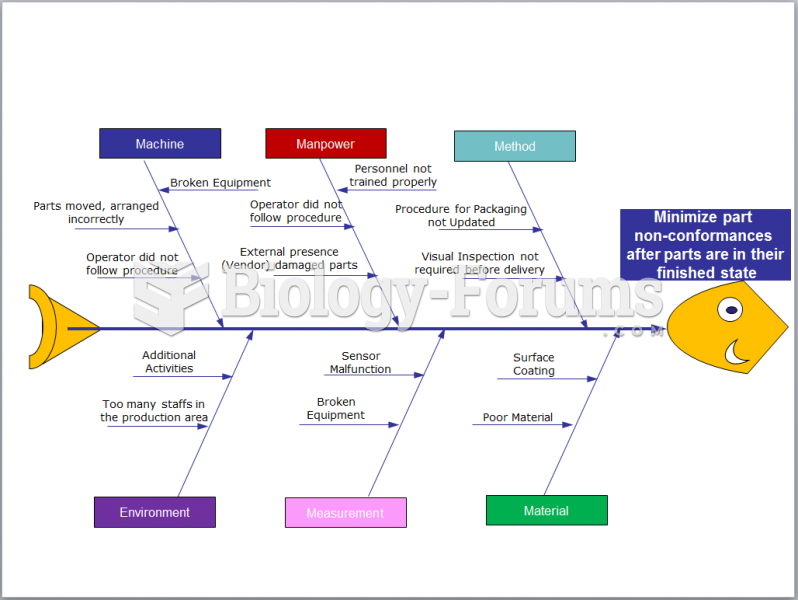 Lean 6 sigma - Fishbone Diagram - CAUSES & Effects OF LOW CUSTOMER SATISFACTION
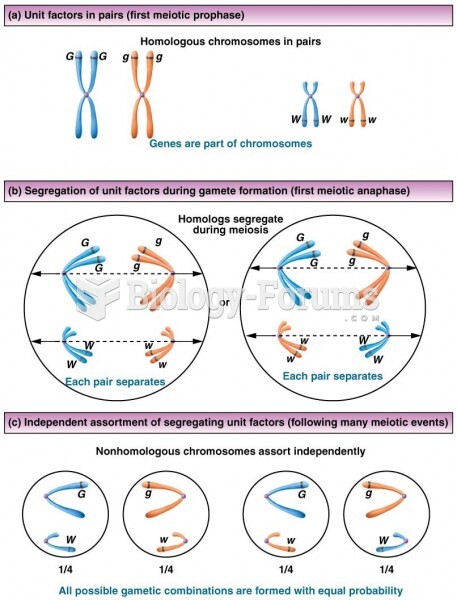 Illustrated correlation between the Mendelian postulates of unit factors
 If the frequency equals 60 Hz in Figure 10-1, what is the value of capacitance?