The total revenue graph consistent with Table 8.1 is
A) linear and upward-sloping.
B) linear and horizontal.
C) linear and vertical.
D) linear and downward-sloping.
E) concave downwards.
Question 2
Two isoquants, which represent different output levels but are derived from the same production function, cannot cross because
A) isoquants represent different utility levels
B) this would violate a technical efficiency condition
C) isoquants are downward sloping
D) additional inputs will not be used by profit maximizing firms if those inputs decrease output
E) Both B and D are true.

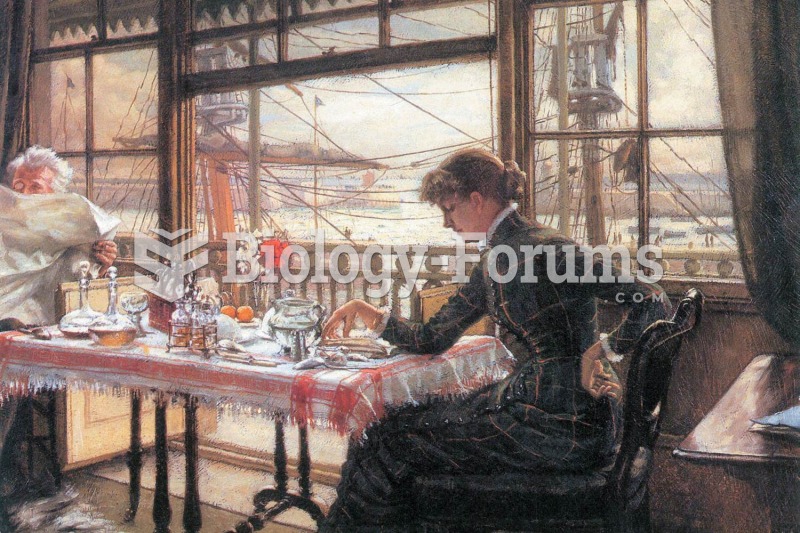 At breakfast, a middle-class husband sits absorbed in the newspaper and the public affairs of the da
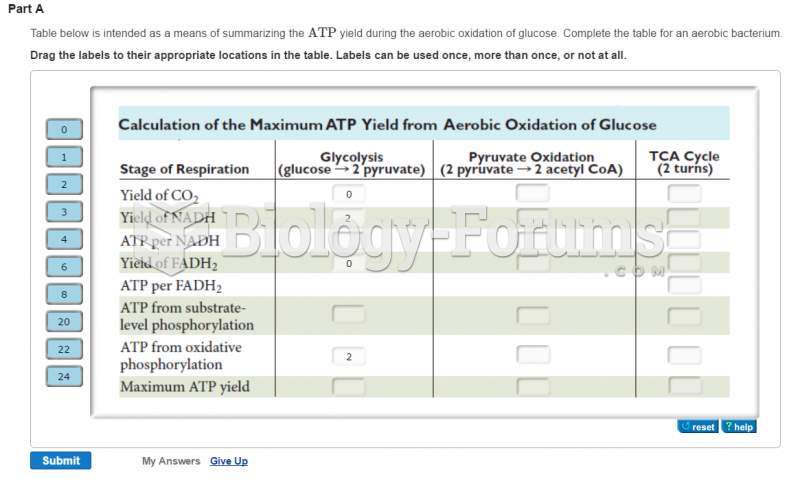 table
table
 Wheelchair Transfer to a Chair or Examination Table
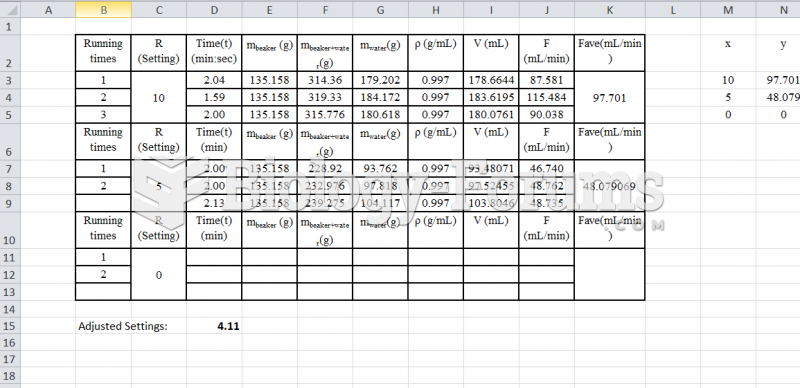 Fluidization - Calibration Table Pump #2
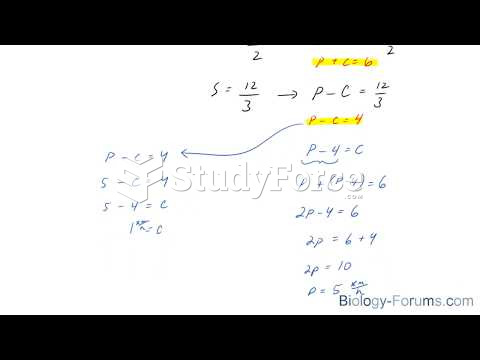 How to solve a distance, time, speed problem using linear algebra
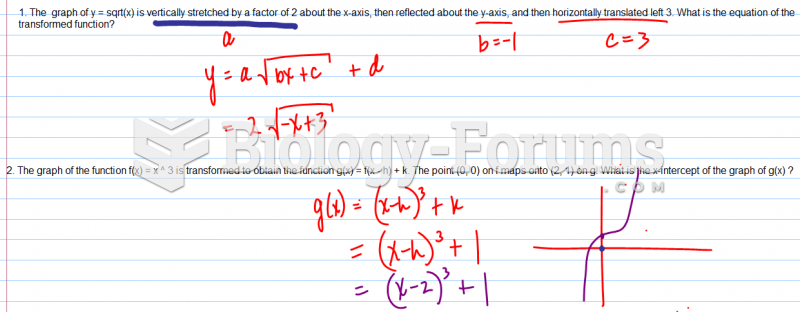 The graph of y = sqrt(x) is vertically stretched by a factor