The total revenue graph consistent with Table 8.1 is
A) linear and upward-sloping.
B) linear and horizontal.
C) linear and vertical.
D) linear and downward-sloping.
E) concave downwards.
Question 2
Two isoquants, which represent different output levels but are derived from the same production function, cannot cross because
A) isoquants represent different utility levels
B) this would violate a technical efficiency condition
C) isoquants are downward sloping
D) additional inputs will not be used by profit maximizing firms if those inputs decrease output
E) Both B and D are true.

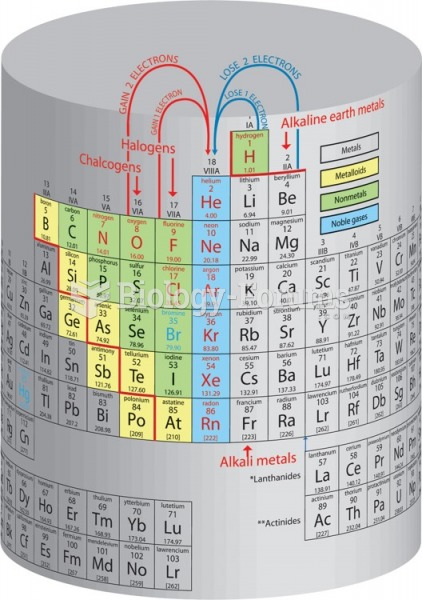 The periodic cylinder of the elements. When the periodic table is folded in such a way that the ...
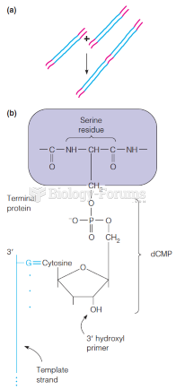 Strategies for replicating linear genomes
 Graph the function by hand & label key points on graph:
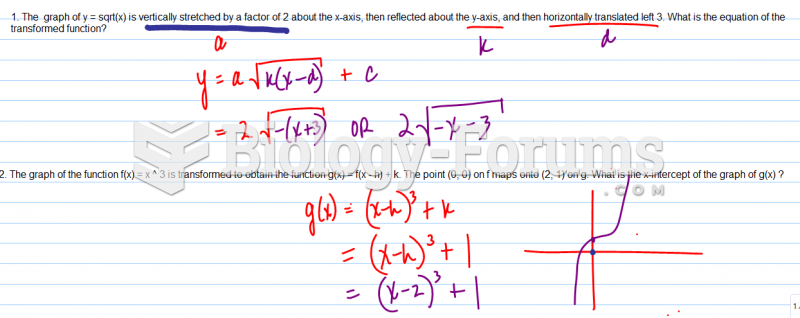 The graph of y = sqrt(x) is vertically stretched by a factor
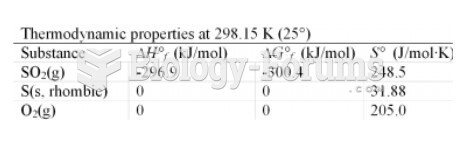 table
table
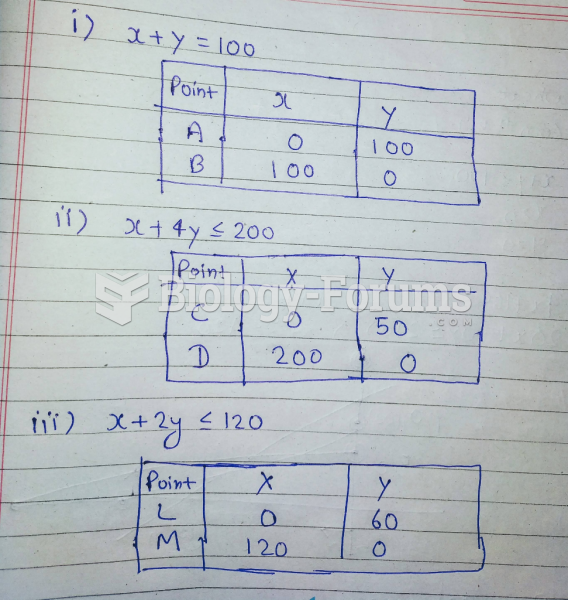 Linear programming problems using the simplex method.