The total revenue graph consistent with Table 8.1 is
A) linear and upward-sloping.
B) linear and horizontal.
C) linear and vertical.
D) linear and downward-sloping.
E) concave downwards.
Question 2
Two isoquants, which represent different output levels but are derived from the same production function, cannot cross because
A) isoquants represent different utility levels
B) this would violate a technical efficiency condition
C) isoquants are downward sloping
D) additional inputs will not be used by profit maximizing firms if those inputs decrease output
E) Both B and D are true.

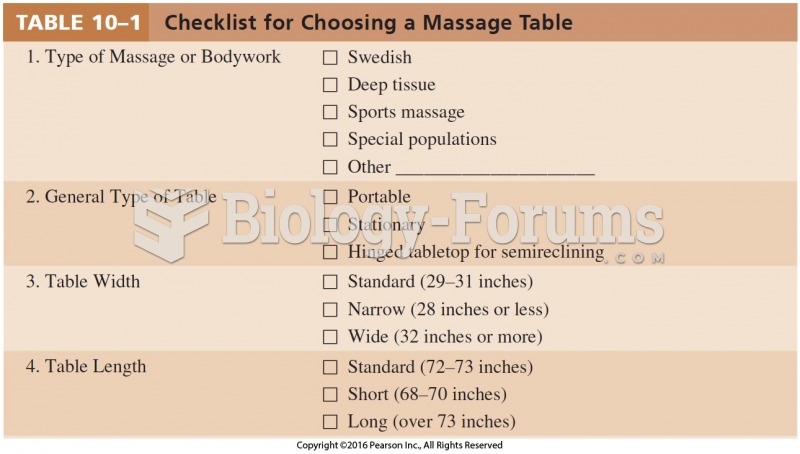 Checklist for Choosing a Massage Table
 Good body mechanics when facing the table directly. A. Head and back in alignment. B. Legs and feet ...
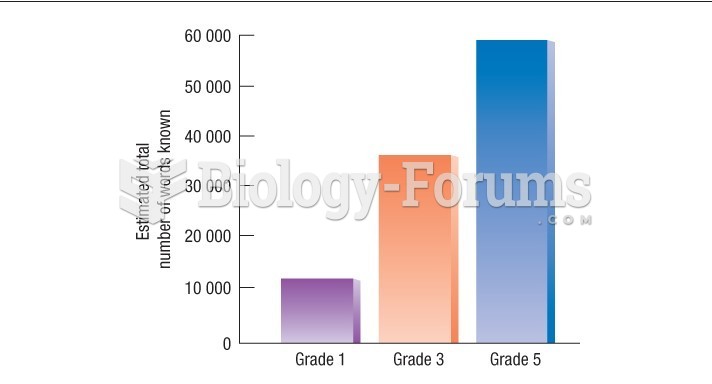 Anglin's estimates of the total vocabulary of children in Grades 1, 3, and 5
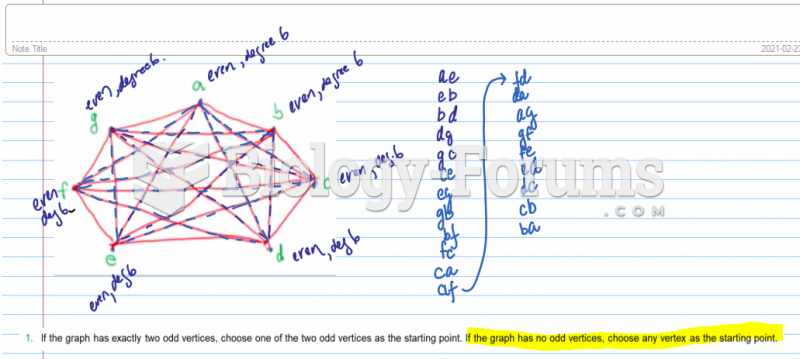 Use Fleury’s algorithm to determine Euler Circuit in the following graph. Exhibit exactly one ...
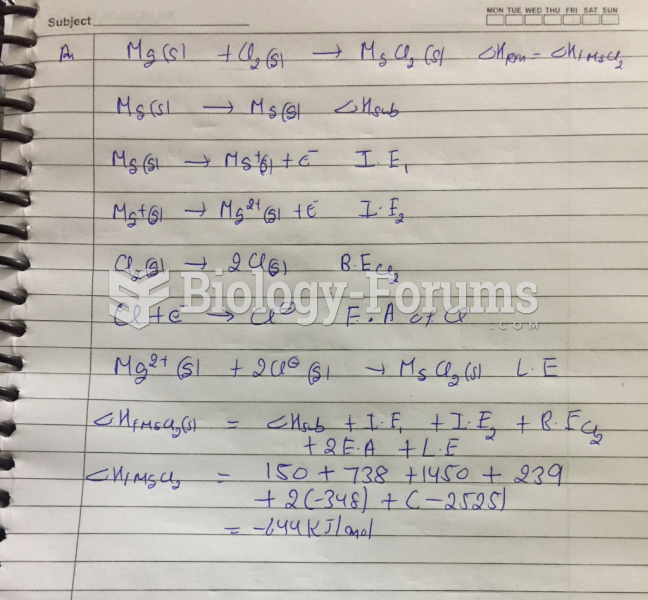 Use the information in the above table to establish a Born-Haber cycle to determine the ...
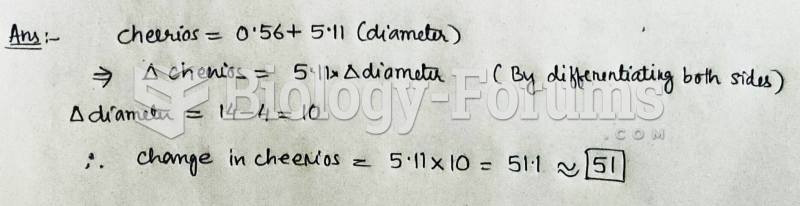 An 8th grade class develops a linear model that predicts the number of cheerios (a small round ...