This topic contains a solution. Click here to go to the answer
|
|
|

 Sublingual medication administration. Photograph of a male patient placing a nitroglycerine tablet u
 Eugène Delacroix, Liberty Leading the People.
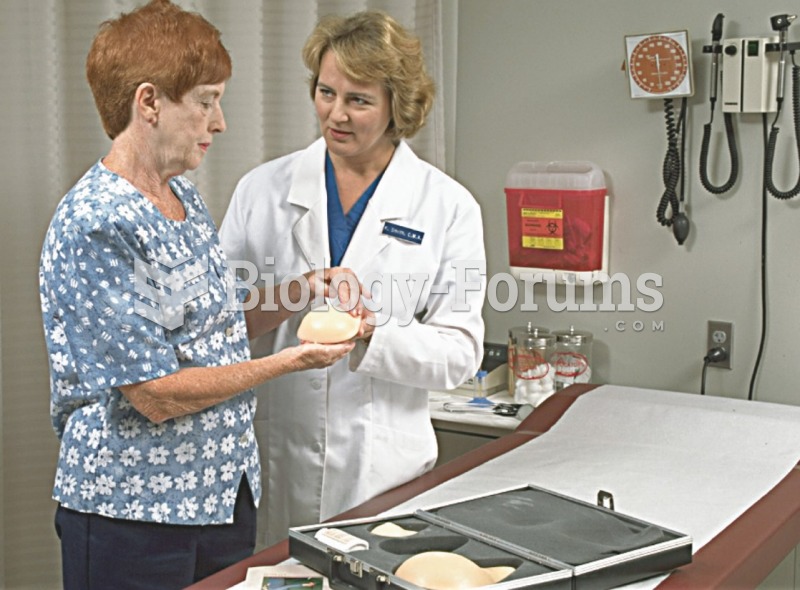 Instructing a Patient on Breast Self-Examination
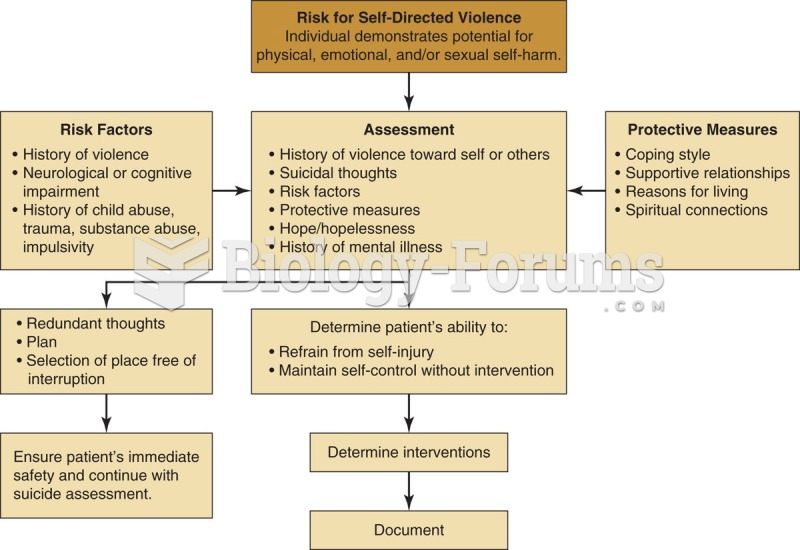 Algorithm for assessing a patient at risk for self-directed violence.
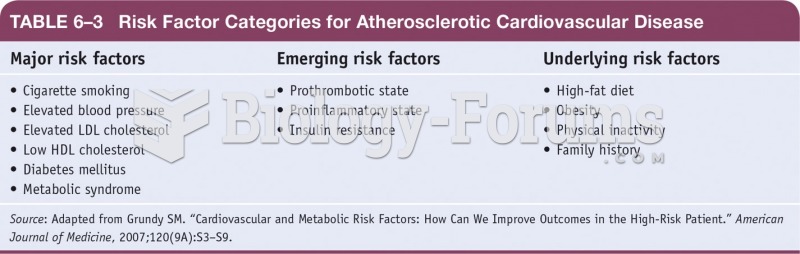 Risk Factor Categories for Atherosclerotic Cardiovascular Disease
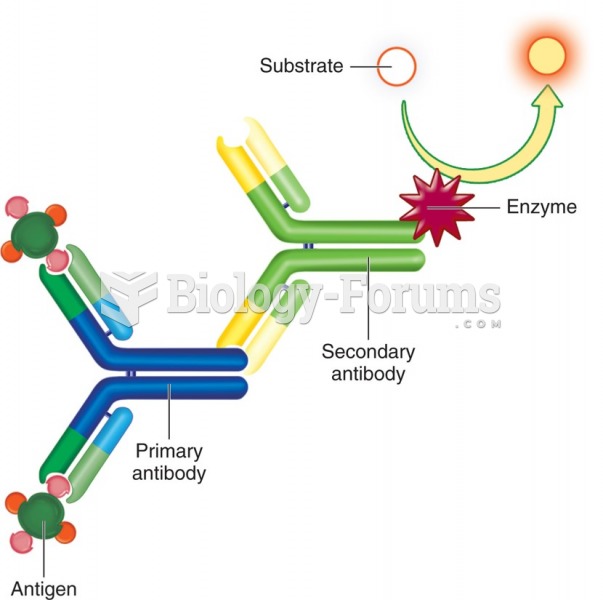 Indirect enzyme immunoassay. A patient's antibody reacts with the antigen, which is detected ...