This topic contains a solution. Click here to go to the answer
|
|
|

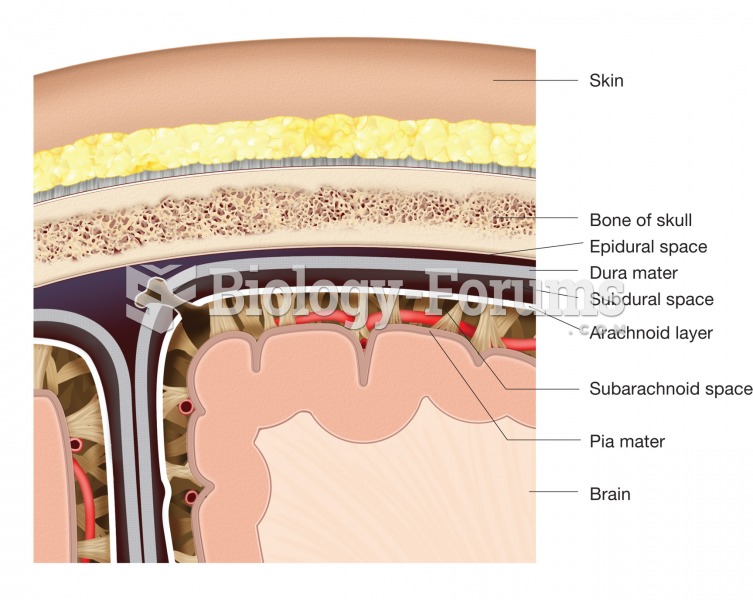 The meninges. This figure illustrates the location and structure of each layer of the meninges and t
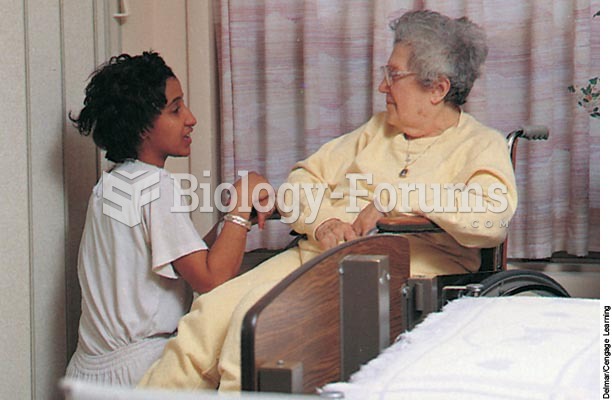 Establishing a caring and trusting relationship helps the client come to terms with a terminal illne
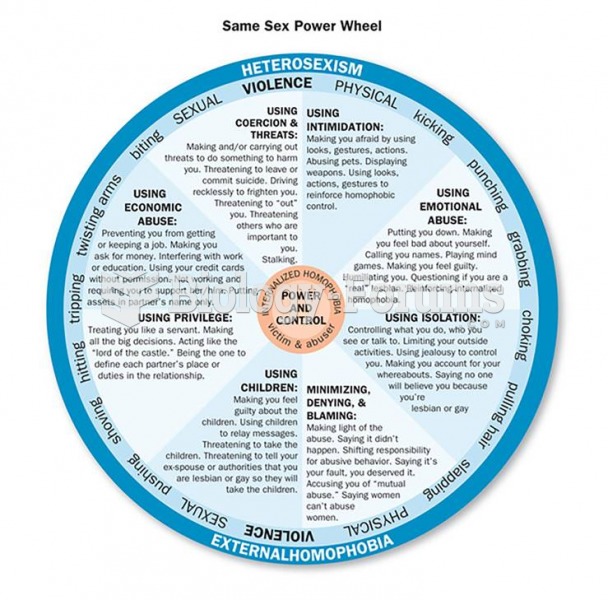 The Power and Control Wheels of Abusive Relationships When one person in a relationship repeatedly ...
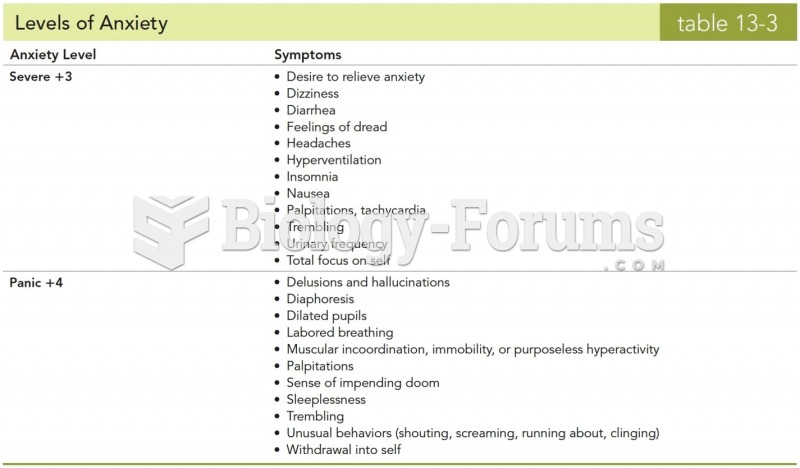 Levels of Anxiety
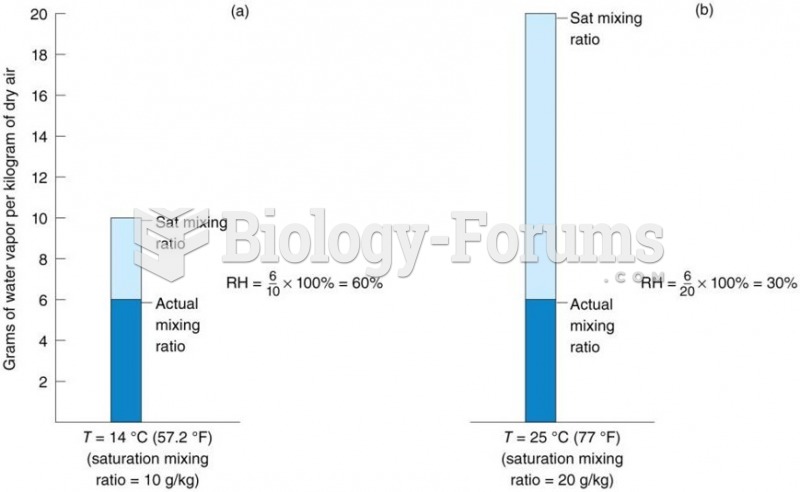 The relationship between RH and temperature.
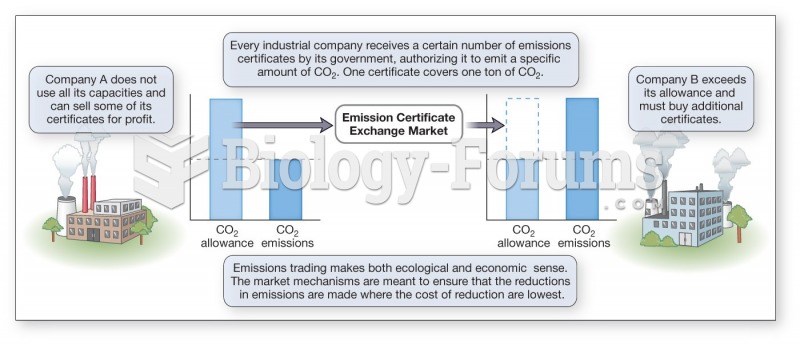 Kyoto Protocol encourages industry to innovate and reduce the level of emissions