This topic contains a solution. Click here to go to the answer
|
|
|

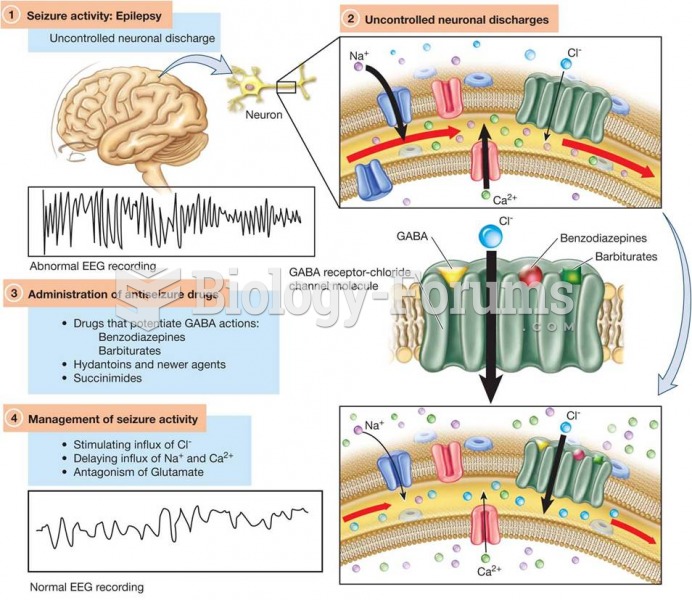 Model of the GABA Receptor–Chloride Channel Molecules in Relationship to Antiseizure Pharmacotherapy
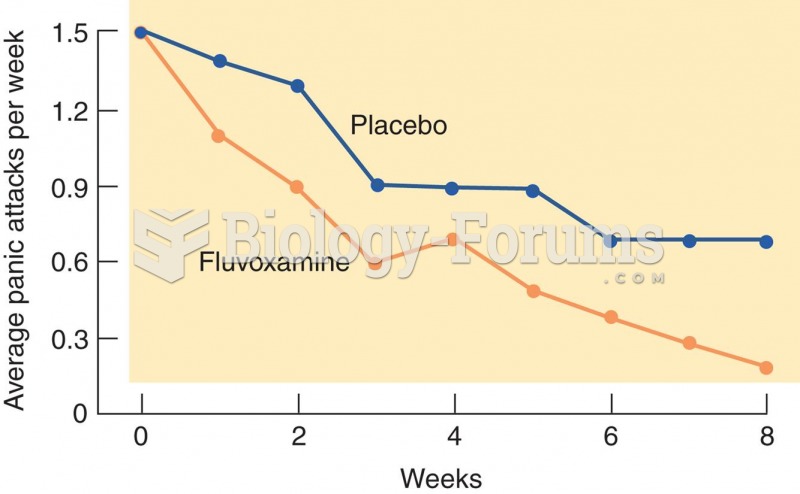 D-Cycloserine and Anxiety Disorders
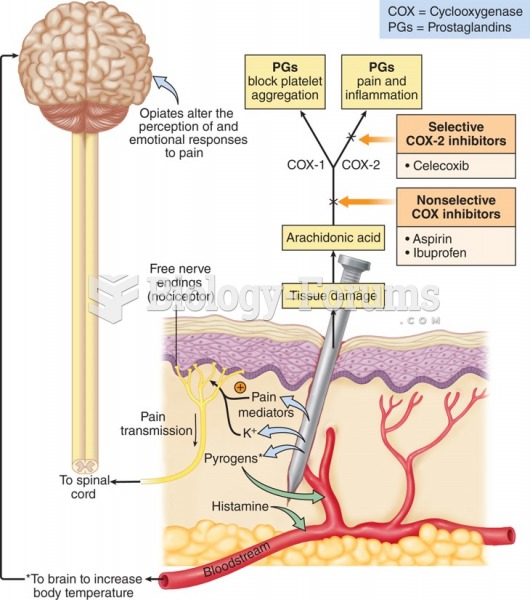 Mechanisms of pain at the nociceptor level.
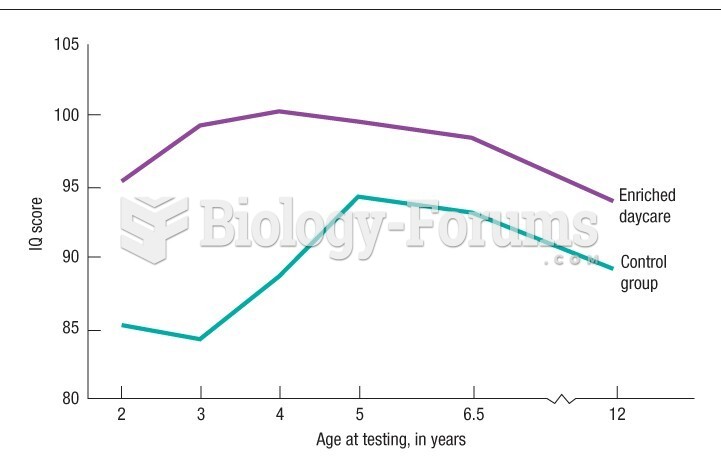 Ramey's study, children from poverty-level families IQ experiment
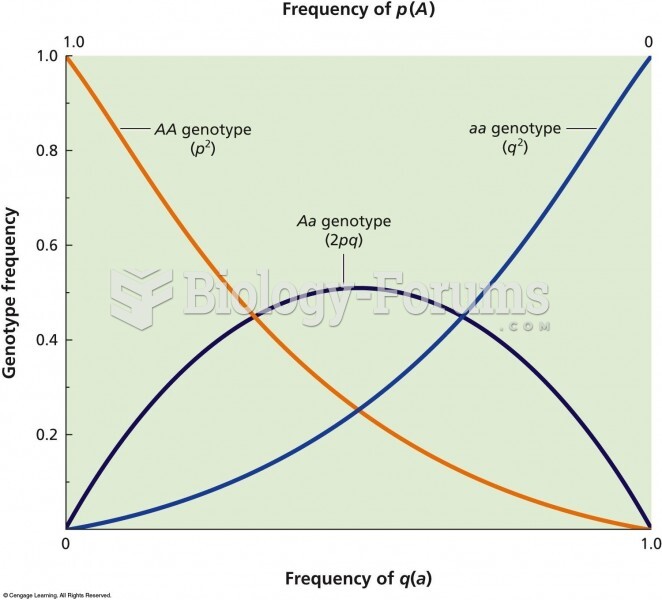 The relationship between allelic frequency and genotypic frequency in a population that is in Hardy-
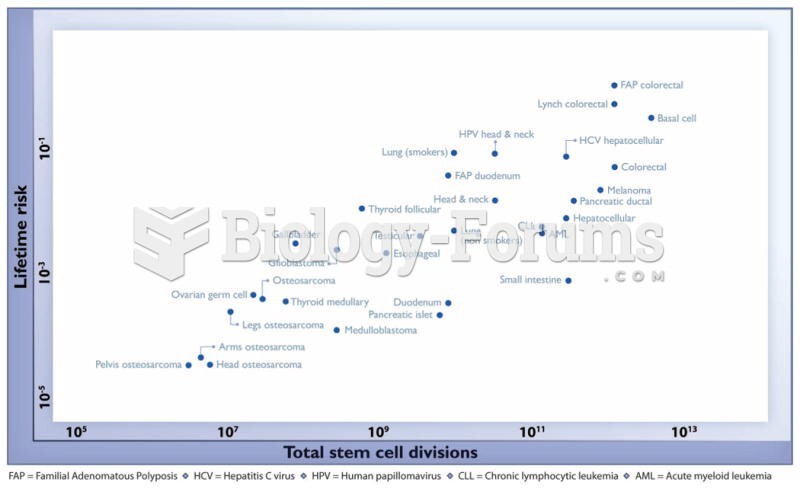 The relationship between the number of stem cell divisions in the lifetime of a given tissue and the