This topic contains a solution. Click here to go to the answer
|
|
|

 Normal development of posture and spinal curves. (A) Toddler: Protruding abdomen; lumbar lordosis. (
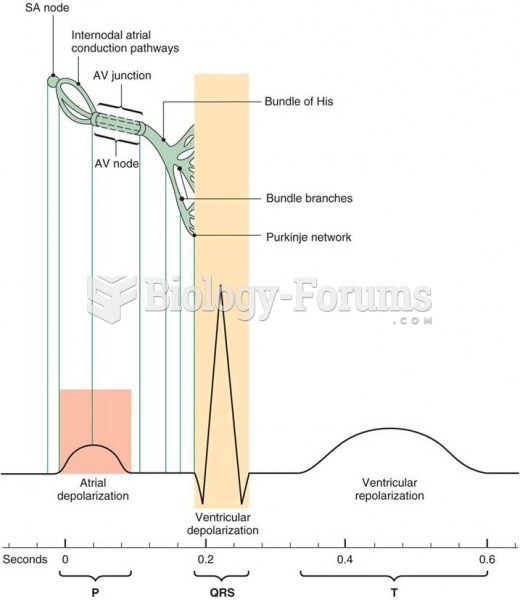 Relationship of the electrocardiogram to electrical conduction in the heart
 Standard Medical Record and Types of Reports Found in Record
 Projections of global temperature depend heavily on the level of future greenhouse gas emissions
 Kyoto Protocol encourages industry to innovate and reduce the level of emissions
 Relationship between Trust and Investment