This topic contains a solution. Click here to go to the answer
|
|
|

Did you know?
Methicillin-resistant Staphylococcus aureus or MRSA was discovered in 1961 in the United Kingdom. It if often referred to as a superbug. MRSA infections cause more deaths in the United States every year than AIDS.

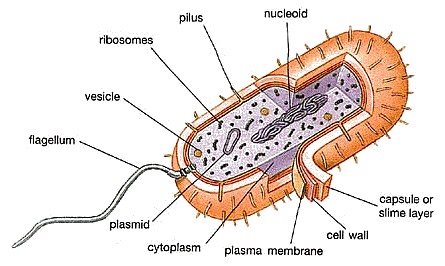 Bacteria Diagram
 Process Flow Diagram of a Dual-Stage Pressure System
 Lean 6 Sigma - LHM SIPOC Diagram
 Diagram of Cross Flow Air Dryer
 Reaction coordinate diagram for a simple enzyme catalyzed reaction
 Diversity Amid Globalization: World Regions, Environment, Development