This topic contains a solution. Click here to go to the answer
|
|
|

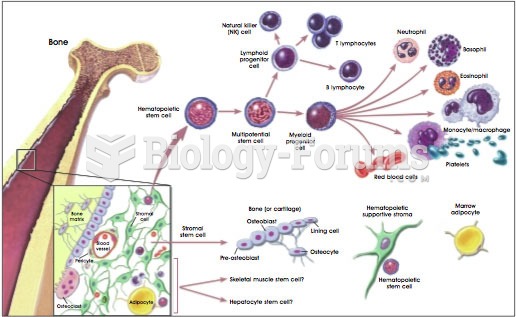 Adult stem cells offer hope for cell therapy to treat diseases in the future
 Future Nurses
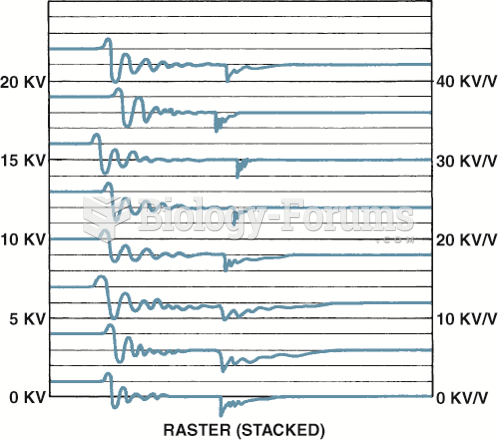 Raster is the best scope position to view the spark lines of all the cylinders to check for ...
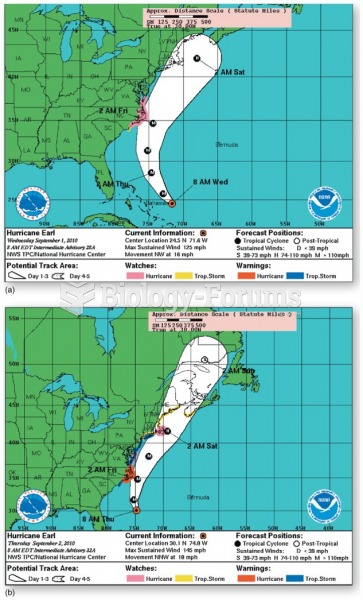 Hurricane Earl Forecast
 How to calculate the future value of a mutual fund
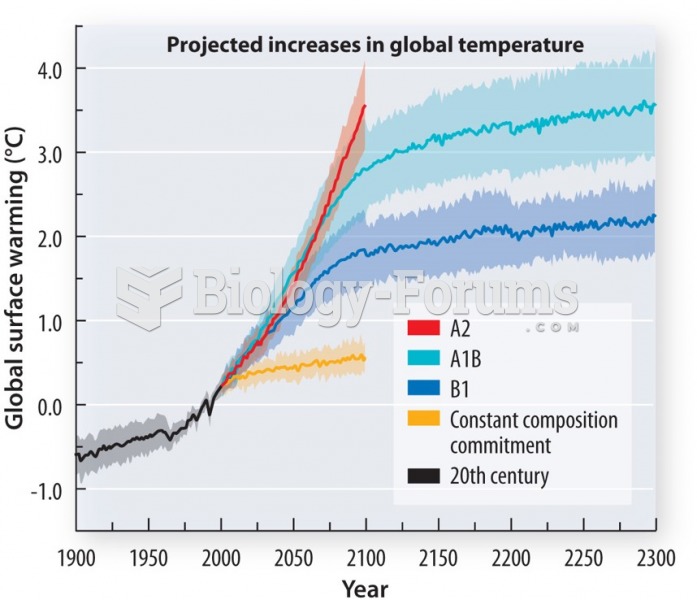 Projections of global temperature depend heavily on the level of future greenhouse gas emissions