This topic contains a solution. Click here to go to the answer

Author Question: An ensemble forecast goes further and further into the future, the forecast lines can become ... (Read 90 times)

frankwu

  • Hero Member
  • *****
  • Posts: 549
An ensemble forecast goes further and further into the future, the forecast lines can become scrambled. Such a chart is often referred to as a
   a. spaghetti plot.
   b. chaos chart.
   c. multilinear plot.
   d. filament chart.
   e. shifting plot.

Question 2


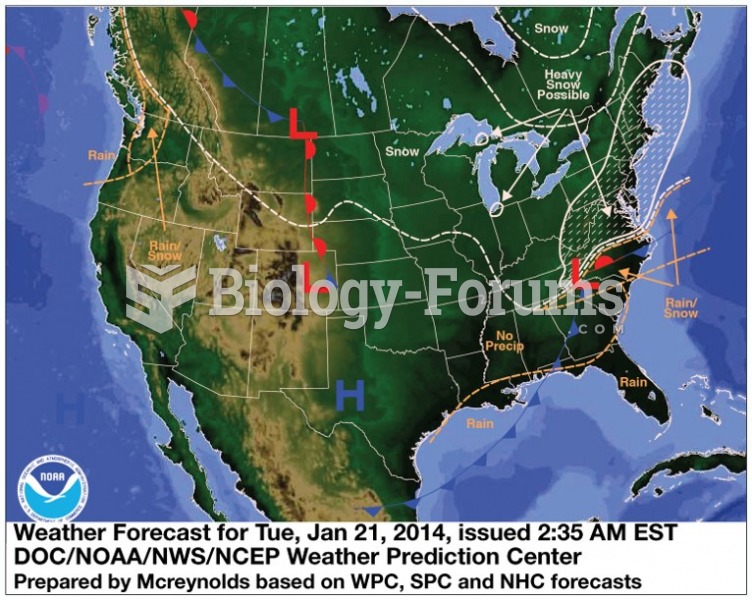
  If you wanted to make a persistence forecast of minimum and maximum temperatures for a particular city, which type of chart would be most helpful?
   a. surface chart
   b. meteogram
   c. 500 mb chart
   d. adiabatic chart
   e. Doppler radar display


Related Topics

Need homework help now?

Ask unlimited questions for free

Ask a Question
Marked as best answer by a Subject Expert

Pariscourtney

  • Sr. Member
  • ****
  • Posts: 352
Answer to Question 1

ANSWER: a

Answer to Question 2

ANSWER: b


frankwu

  • Member
  • Posts: 549
Reply 2 on: Jul 13, 2018
Great answer, keep it coming :)


kthug

  • Member
  • Posts: 332
Reply 3 on: Yesterday
Wow, this really help


Did you know?

The average adult has about 21 square feet of skin.

Did you know?

Asthma cases in Americans are about 75% higher today than they were in 1980.

Did you know?

The training of an anesthesiologist typically requires four years of college, 4 years of medical school, 1 year of internship, and 3 years of residency.

Did you know?

In 2006, a generic antinausea drug named ondansetron was approved. It is used to stop nausea and vomiting associated with surgery, chemotherapy, and radiation therapy.

Did you know?

In 1885, the Lloyd Manufacturing Company of Albany, New York, promoted and sold "Cocaine Toothache Drops" at 15 cents per bottle! In 1914, the Harrison Narcotic Act brought the sale and distribution of this drug under federal control.

For a complete list of videos, visit our video library