This topic contains a solution. Click here to go to the answer
|
|
|

 Press along sen lines and marma points on inner forearm.
 Current and future trends and impacts (IPCC)
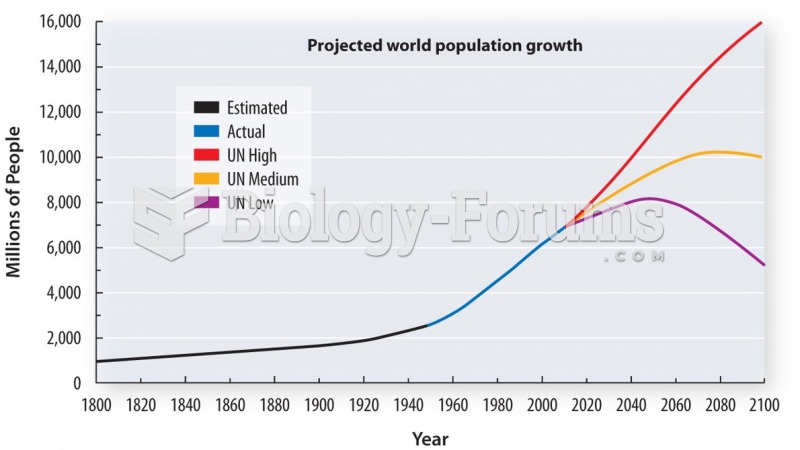 The level of future emissions is closely linked to the rate of population growth
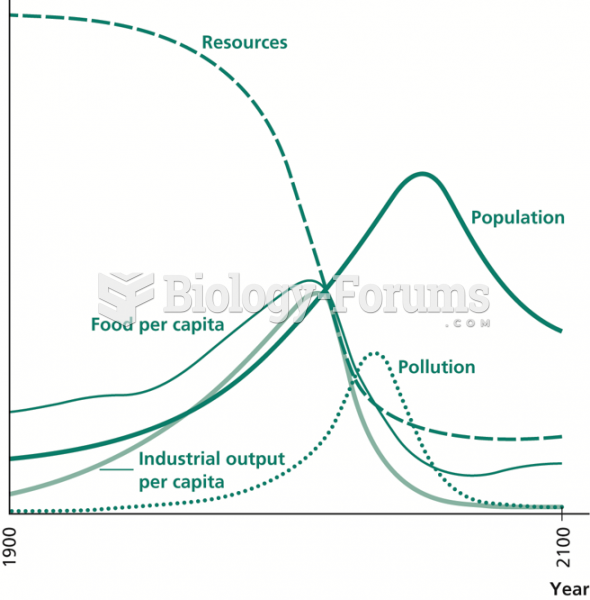 Growth Forecast from The Limits To Growth
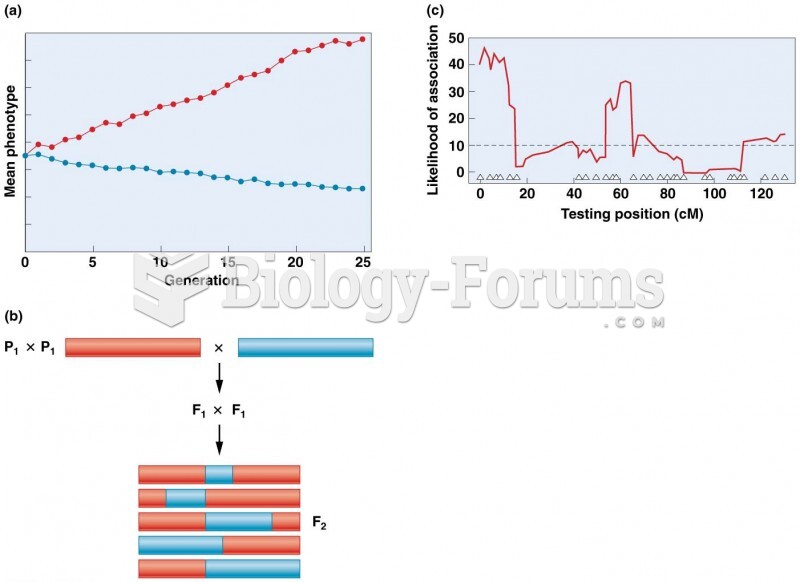 Individuals from highly divergent lines created by artificial selection
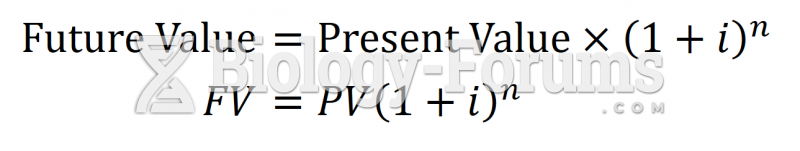 Future Value Formula