This topic contains a solution. Click here to go to the answer
|
|
|

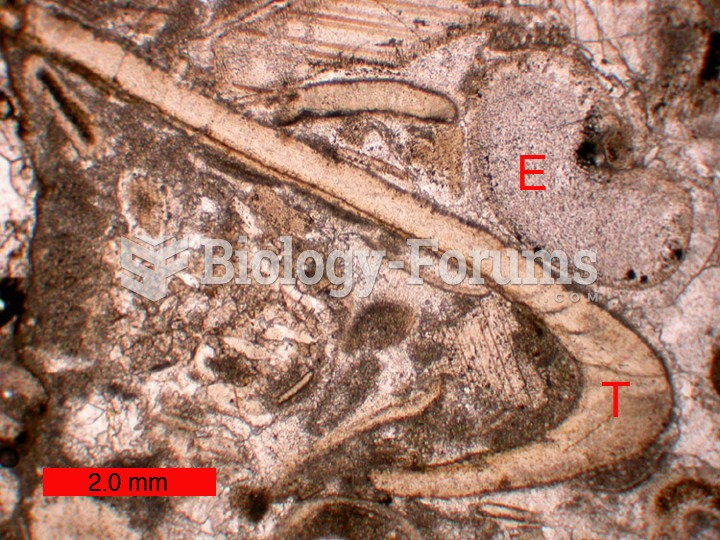 A trilobite fragment (T) in a thin-section of an Ordovician limestone; E=echinoderm; scale bar is 2
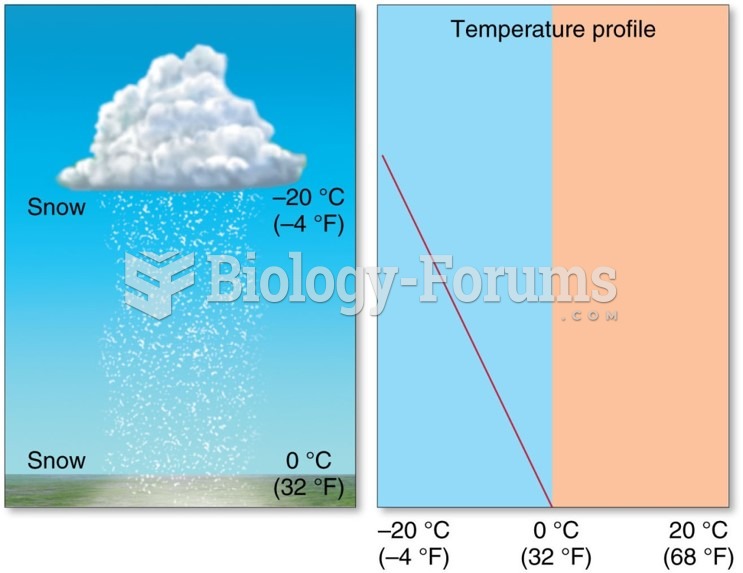 Distribution and Forms of Precipitation: Snow
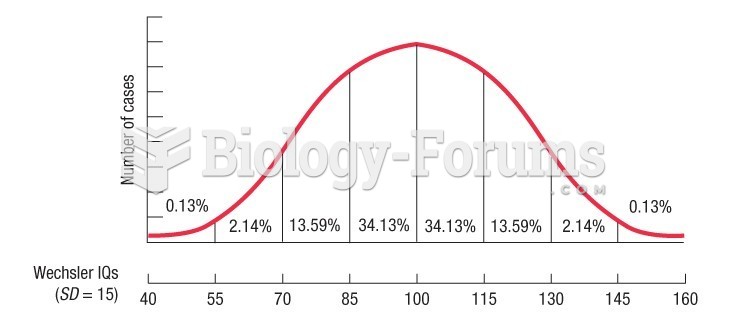 IQ scores form what mathematicians call a normal distribution "bell curve"
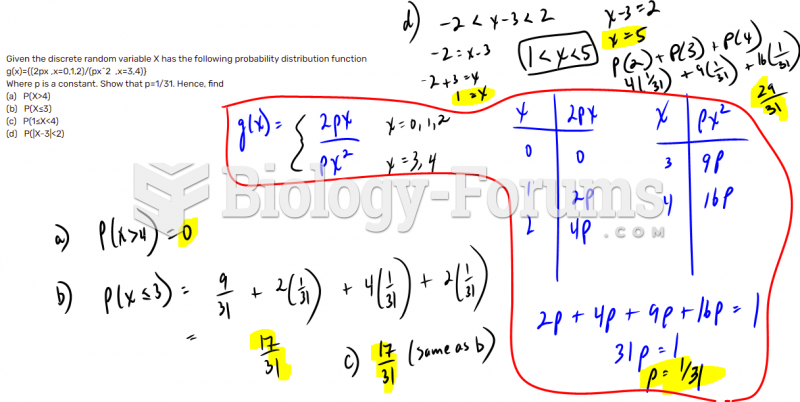 Discrete random variables- Probability Distribution Function
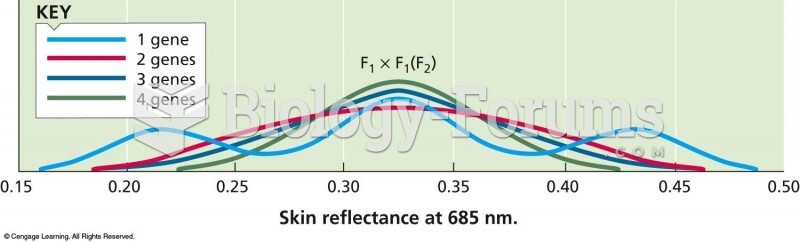 Distribution of skin color as measured by a reflectometer at a wavelength of 685 nm. The results are
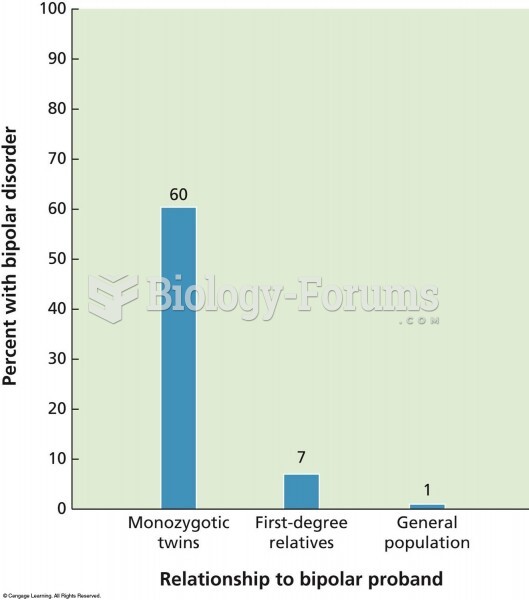 The frequency of bipolar illness in members of monozygotic twin pairs and in first-degree relatives