This topic contains a solution. Click here to go to the answer
|
|
|

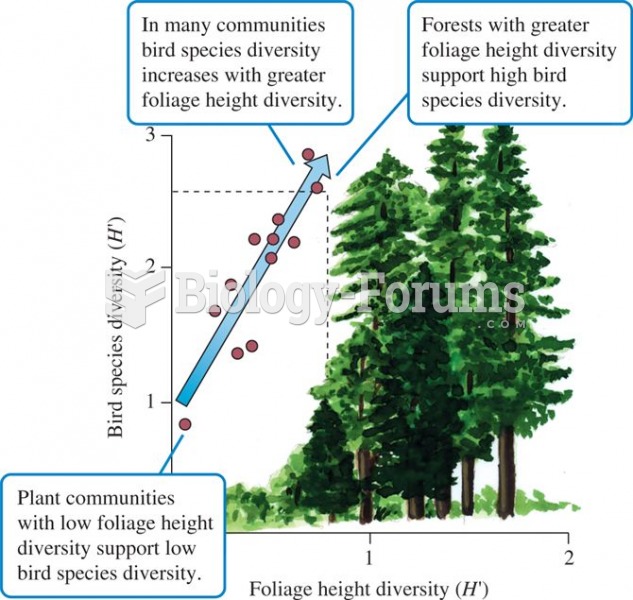 Foliage height diversity and bird species diversity (data from MacArthur and MacArthur 1961).
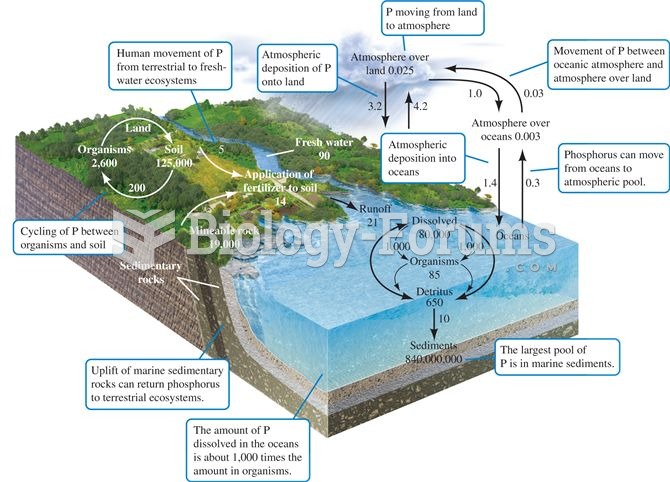 The phosphorus cycle. Numbers are 1012 g P or fluxes as 1012 g P per year (data from Schlesinger 199
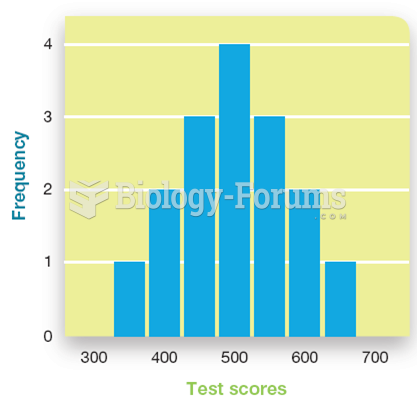 Graphing Psychological Data
 A physician uses a portable electronic tablet to enter patient data while in the examination room.
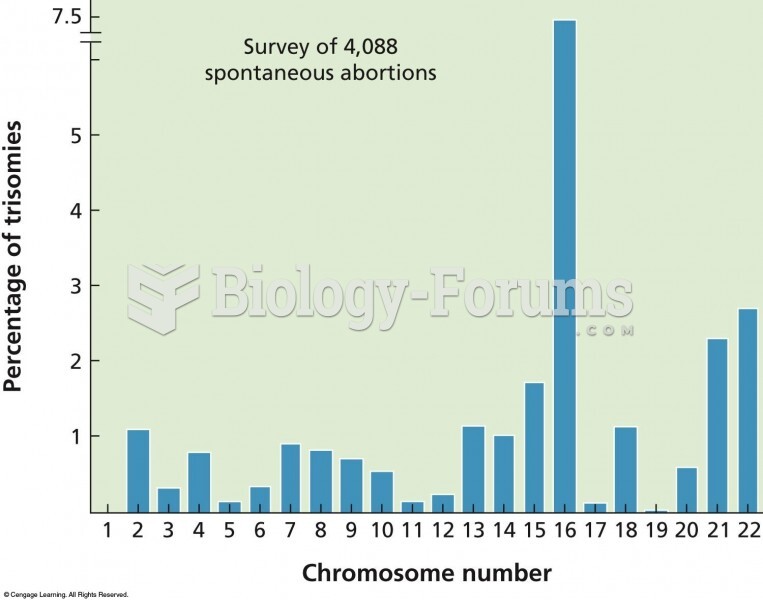 The results of a cytogenetic survey of over 4,000 miscarriages show a wide variation in how often sp
 Linkage Data from 39 Families with Cystic Fibrosis