Right before the graphs are shown in the video, one person in the video says, Quantifying online campaigns is tricky. Why do they care about quantifying online campaigns?
A. They believe that if they can show policy makers how many people are actively supporting marriage equality by participating in this campaign, they may be able to influence policy makers' decisions.
B. Policy makers were asking for the ages of people who participate in online campaigns and whether their ages are different than those who participate in traditional campaigns such as marches.
C. Facebook won't allow people to change their profile picture in support of this campaign unless they know how many people want to change their profile picture.
D. They are interested in how the symbol changed to, for example, images of bacon or cake, and how many different versions there were.
Question 2
The video shows three different types of graphs/depictions: a scatter diagram, a map of the United States, and a network graph. What did the scatter diagram show? The scatter diagram was the plot showing black dots.
A. That the people in the United States who were most likely to change their Facebook profile picture were between the ages of 20 and 30.
B. The distribution of the locations of people in the United States who changed their Facebook profile pictures.
C. How interconnected are Twitter users when discussing issues such as marriage equality.
D. The number of people who changed their profile image at particular times and dates.

 Salt marsh channels shown in cross section.
 James Madison was a key figure at the Constitutional Convention of 1787 in Philadelphia. He not only
 The Kingsley plantation, on Fort George Island in Jacksonville, Florida. Zephaniah Kingsley, the own
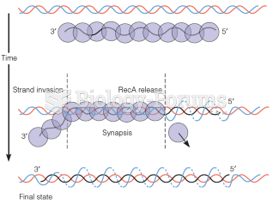 The RecA strand exchange reaction as shown from single-molecule studies
 Patrick Baker - Only (Official Music Video)