This topic contains a solution. Click here to go to the answer
|
|
|

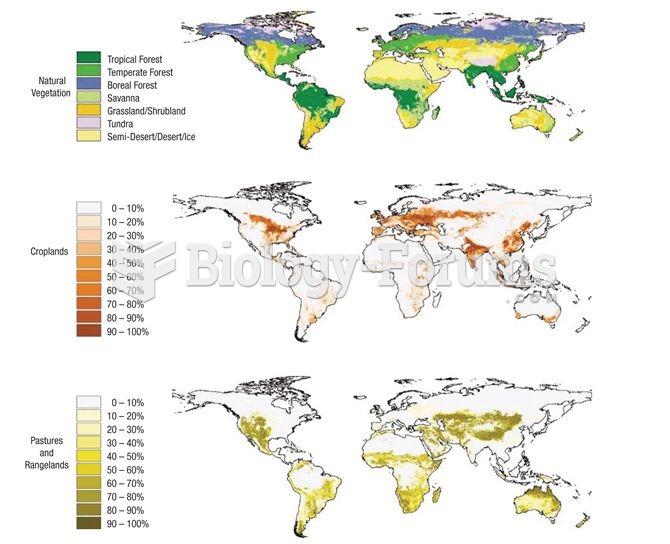 Extent of agricultural activity across the planet (data from Foley et al. 2005).
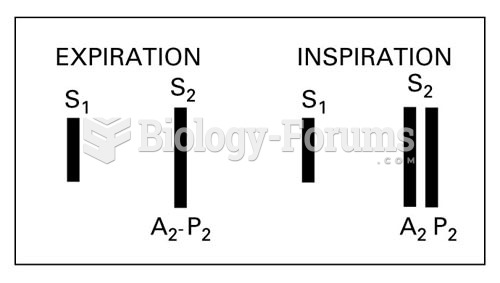 Summation of Heart Sounds, Normal Physiological Split of S2
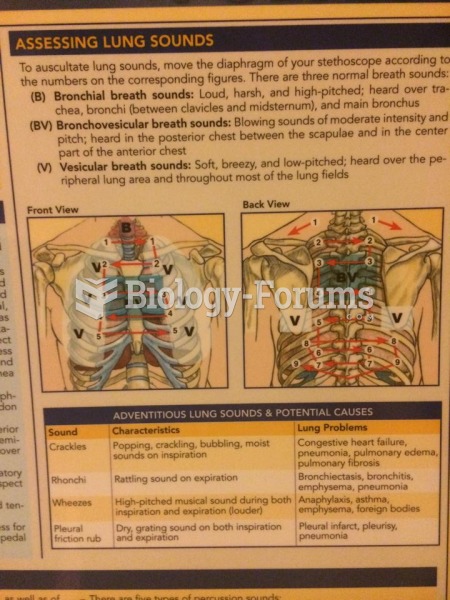 Assessing Lung Sounds
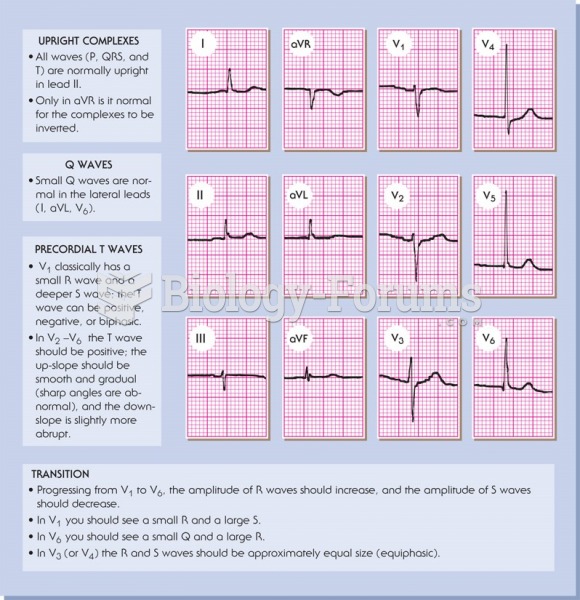 Features of a normal 12-lead ECG.
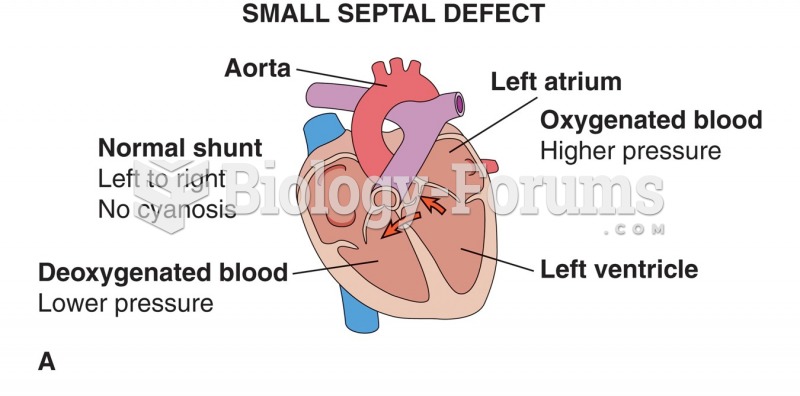 Effects of septal defects: (A) normal shunt; no cyanosis; (B) increased pressure in right ventricle; ...
 How to calculate theoretical probability