|
|
|

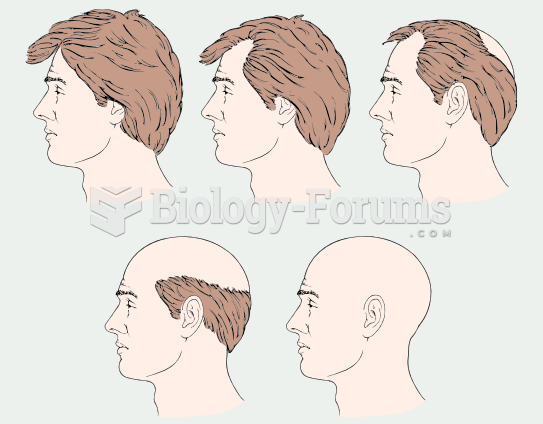 Male Pattern Balding
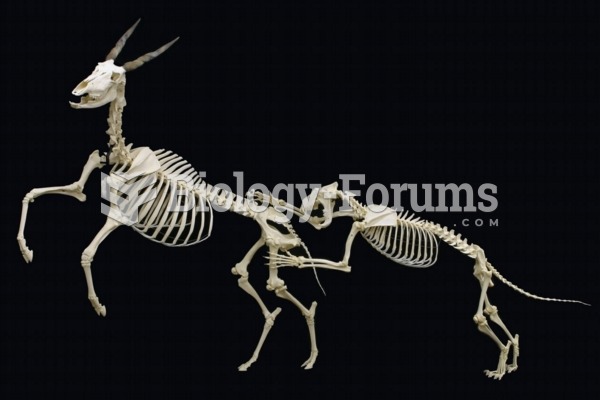 A skeletal mount of an African Lion attacking a Common Eland on display at The Museum of Osteology,
 Threat display by a Sydney funnel-web spider (Atrax robustus).
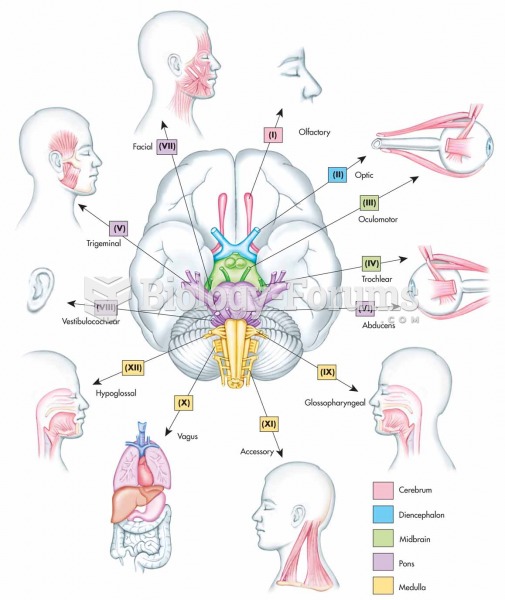 Relationship of the 12 cranial nerves to specific regions of the brain.
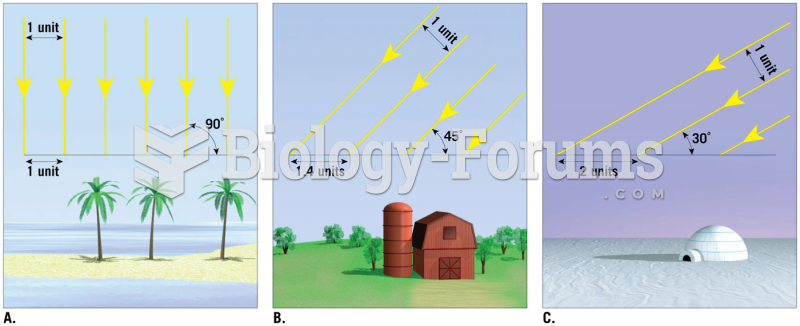 Relationship of Sun Angle and Solar Radiation
 Relationship between the number of amino acid substitutions