This topic contains a solution. Click here to go to the answer
|
|
|

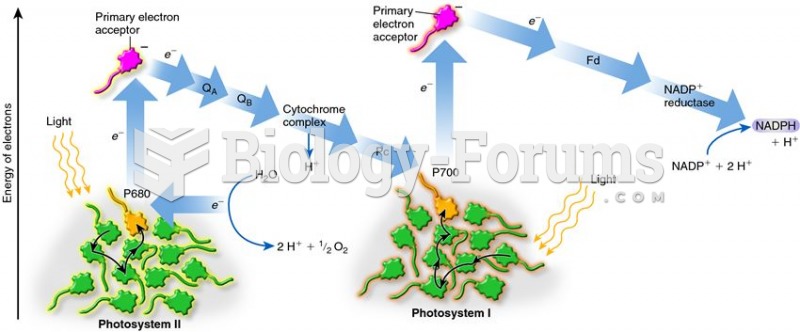 The Z scheme, which depicts the energy of an electron as it moves from photosystem II to NADP+
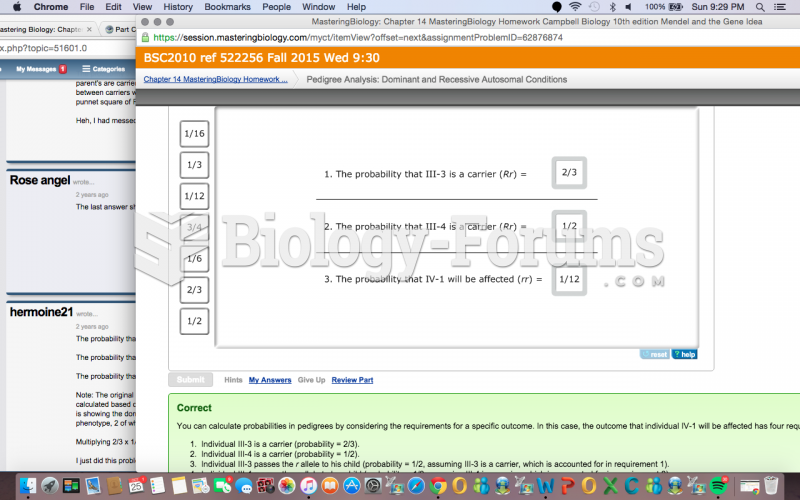 The pedigree from Part C is shown below.
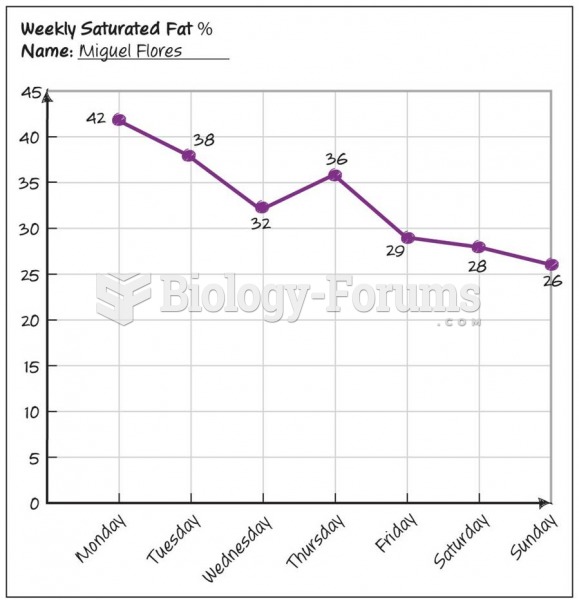 Progression Graph
 Performing a Spirometry Test to Measure Forced Vital Capacity
 Hand signals are an effective emergency backup to ra- dio communication systems. Shown are several ...
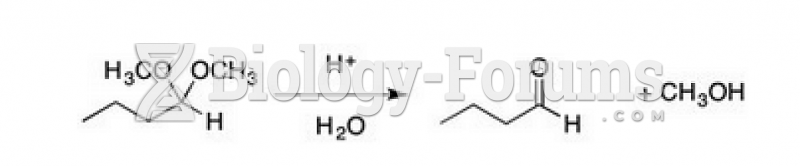 Draw a full and complete mechanism for the following reaction shown below.