|
|
|

 Summary of US Census Data
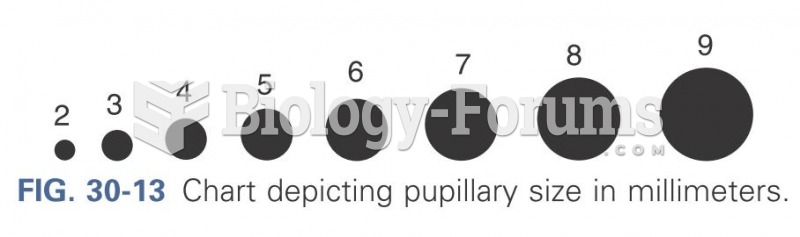 Chart depicting pupillary size in millimeters
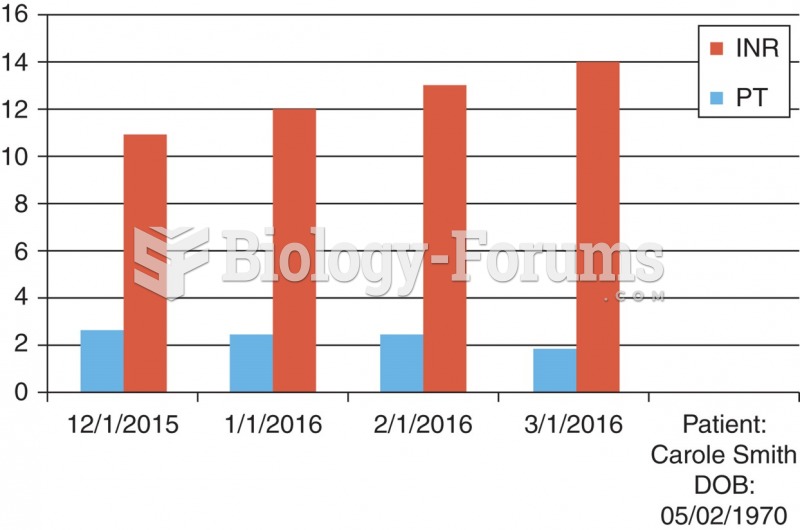 A chart derived from a flow sheet.
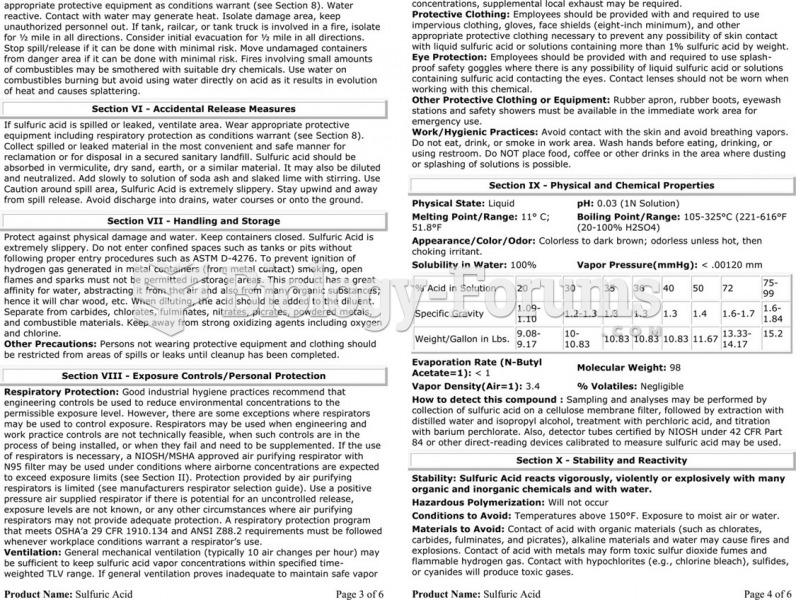 The material safety data sheet (MSDS) for sulfuric acid showing the detailed technical information ...
 Demographic Data for India
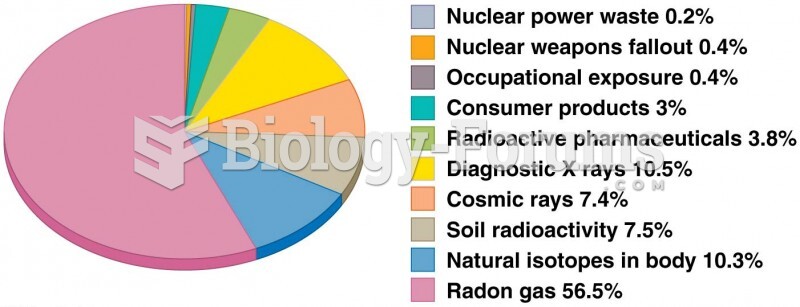 Chart showing average yearly dose of radiation from natural and human-made sources