|
|
|

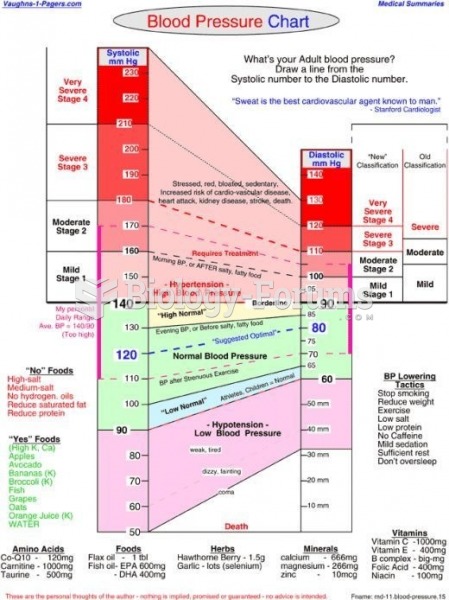 Blood Pressure Chart
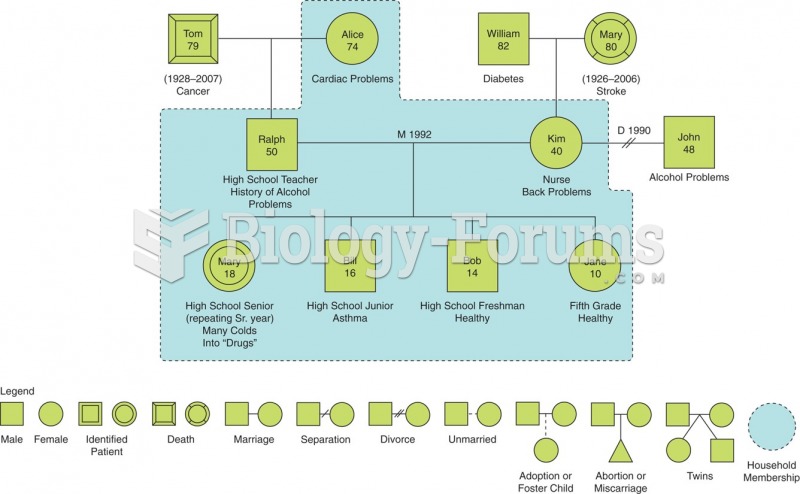 Example of a family genogram with accompanying legend (symbols used in genograms).
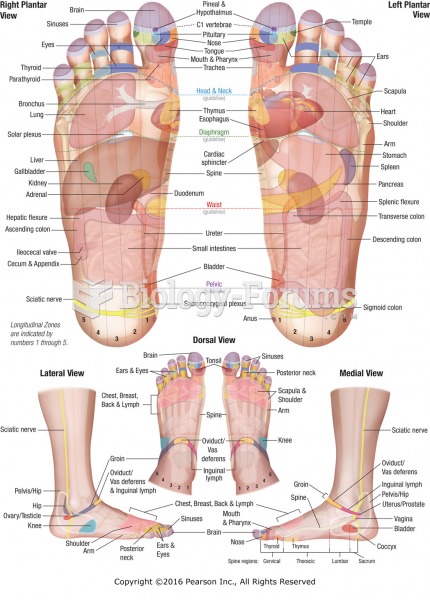 Reflexology chart showing location of reflexes with corresponding anatomical structures and organs ...
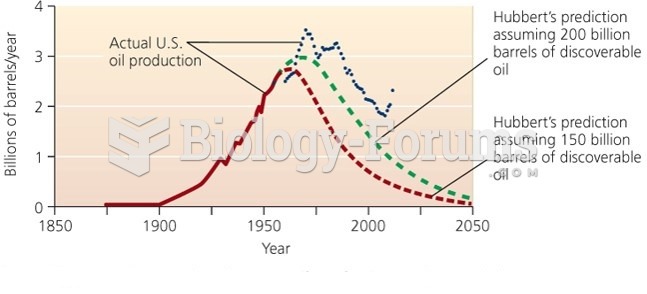 Hubbard’s Predication of Peak in U.S Oil Production with Actual Data
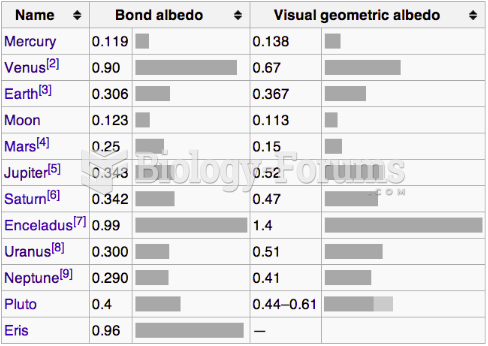 Albedo Chart
 A 16-input multiplexer is to be used to perform parallel-to-serial data conversion. Which of ...