|
|
|

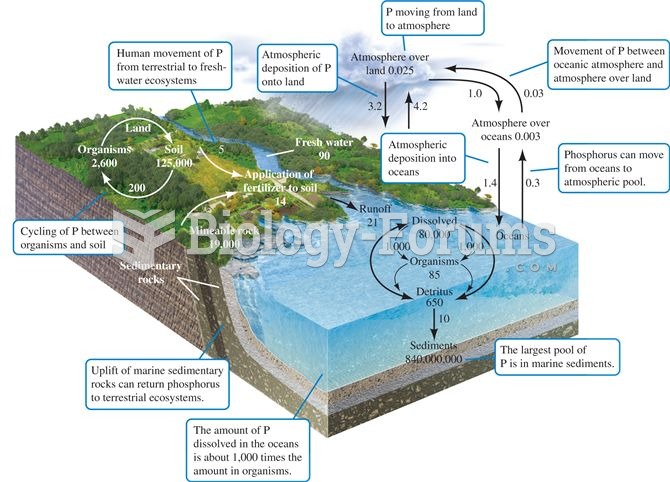 The phosphorus cycle. Numbers are 1012 g P or fluxes as 1012 g P per year (data from Schlesinger 199
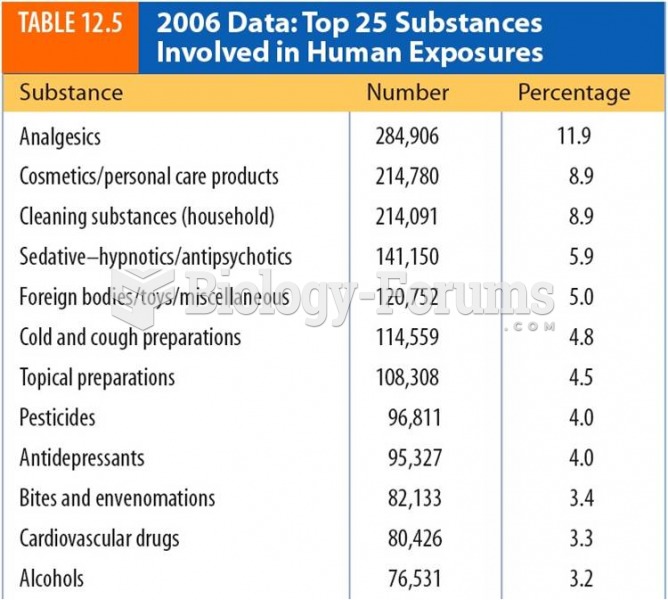 2006 Data:Top 25 Substances Involved in Human Exposures
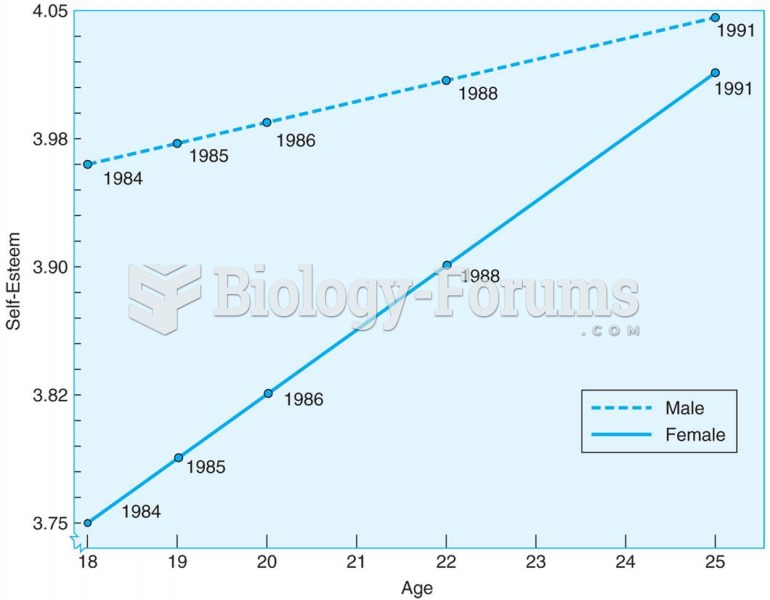 Young adults increase in self-esteem between the ages of 18 and 25, according to this longitudinal s
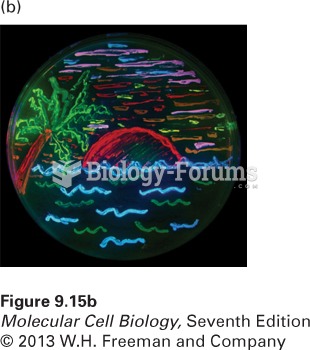 Many different colors of fluorescent proteins are now available
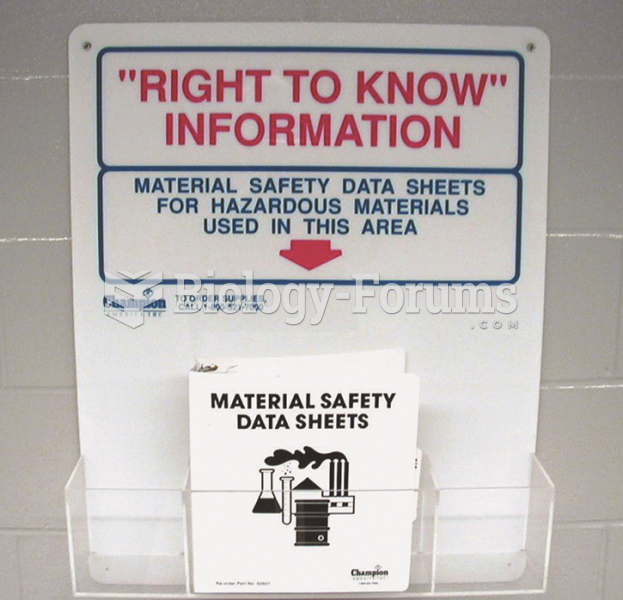 Material safety data sheets (MSDS), now called safety data sheets (SDS), should be readily available ...
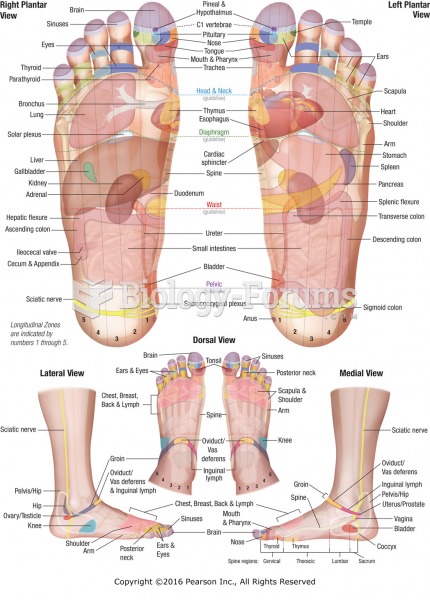 Reflexology chart showing location of reflexes with corresponding anatomical structures and organs ...