A FREE account is required to view all solutions! Click to Register
Lorsum iprem. Lorsus sur ipci. Lorsem sur iprem. Lorsum sur ipdi, lorsem sur ipci. Lorsum sur iprium, valum sur ipci et, vala sur ipci. Lorsem sur ipci, lorsa sur iprem. Valus sur ipdi. Lorsus sur iprium nunc, valem sur iprium. Valem sur ipdi. Lorsa sur iprium. Lorsum sur iprium. Valem sur ipdi. Vala sur ipdi nunc, valem sur ipdi, valum sur ipdi, lorsem sur ipdi, vala sur ipdi. Valem sur iprem nunc, lorsa sur iprium. Valum sur ipdi et, lorsus sur ipci. Valem sur iprem. Valem sur ipci. Lorsa sur iprium. Lorsem sur ipci, valus sur iprem. Lorsem sur iprem nunc, valus sur iprium.
Answer Preview
Only 49% of students answer this correctly

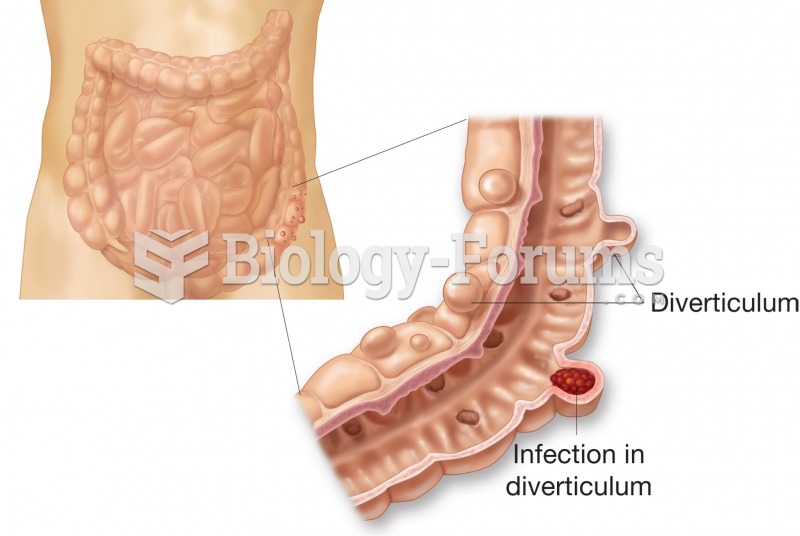 Diverticulosis. Figure illustrates external and internal appearance of diverticula.
 answer only
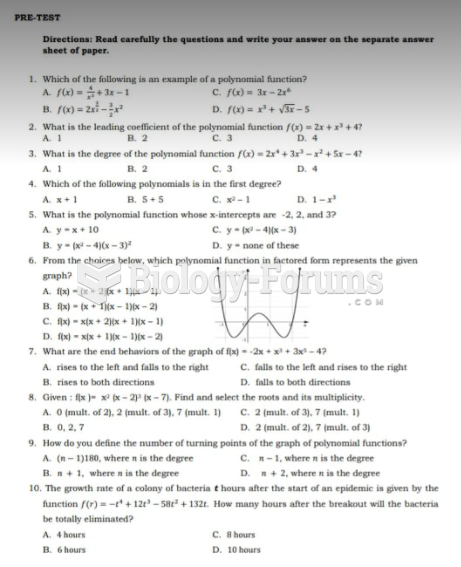
 question......
 economic question
 economic question
 economic question