This topic contains a solution. Click here to go to the answer
|
|
|

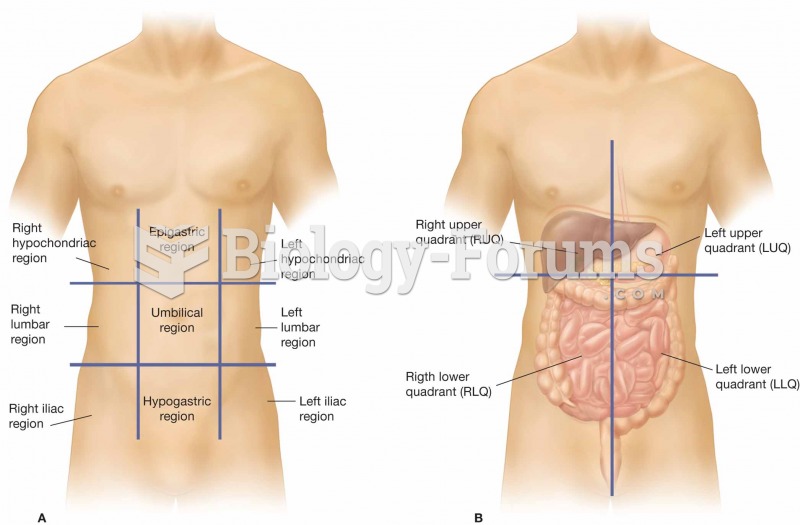 (A) The nine regions of the abdominopelvic cavity. (B) The four regions of the abdomen, which are re
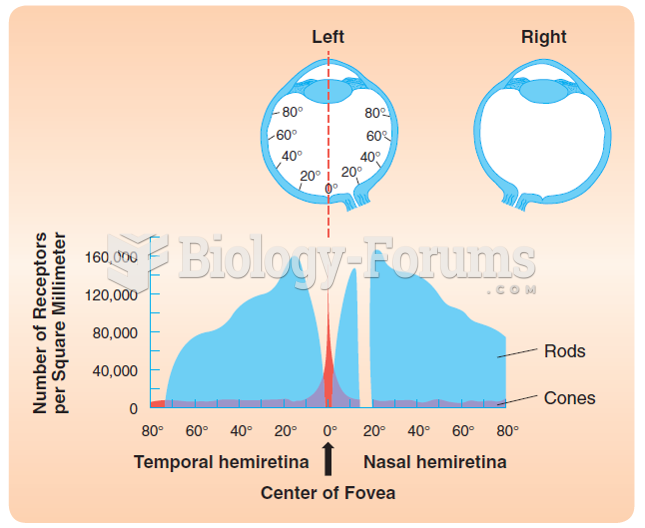 The distribution of cones and rods over the human retina. The figure illustrates the number of cones ...
 How to create a table of values displaying commission and earnings (Question 2)
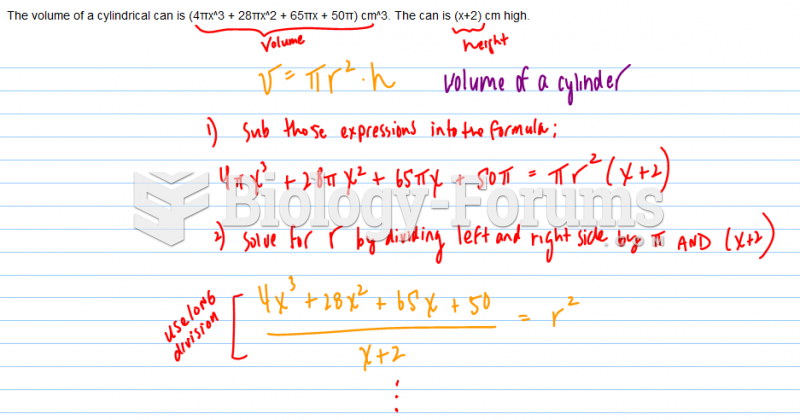 Cylinder Cubic Question
 MATH ODDS AND PROBABILITY PLEASE ANSWER THE PICTURE
 Refer to Scenario 3.1. If the price of potato chips is $0.50 and the price of Cola is $4.00, ...